Data for 1931
Historical GDP per Capita (Maddison), 1931
1931, as GGDC’s 2023 release gives it · stored as published, never rewritten
Historical GDP per capita follows each country's output per person back to 1820, in 2011 international dollars, from the Maddison Project Database. It joins economic historians' reconstructions of old national accounts onto modern statistics, so that incomes two centuries apart can be set on one scale.
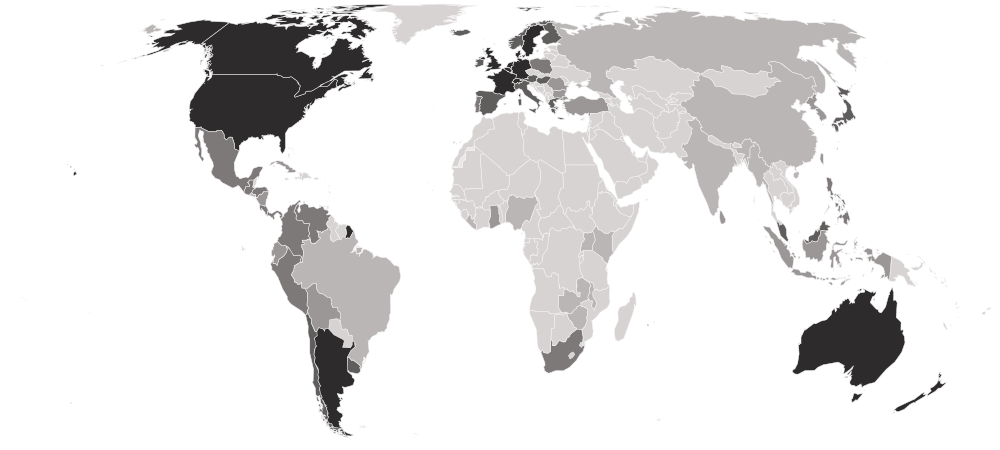
Historical GDP per Capita (Maddison), 1931 covers 65 countries. Switzerland is highest, at 10,055; Zambia is lowest, at 619. The middle country reads 2,397. Against 1930, 63 values changed (15 up, 48 down), 1 country joined.
Historical GDP per Capita (Maddison) · Data for 1931

HighestSwitzerland
10,055
LowestZambia
619Shaded by value in five groups of equal size, darkest at the better end.
01Position · derived
The table
Every country and every column of Historical GDP per Capita (Maddison), 1931, as published. GGDC ranks nobody on this measure; the position is derived here by ordering the published values. “=” marks a shared position.
Showing 25 of 65 countries · select a heading to sort
| derived | ||
|---|---|---|
| 1 | SwitzerlandCHEWestern Europe | 10,055 |
| 2 |  United States USANorthern America | 9,931 |
| 3 |  Denmark DNKNorthern Europe | 8,542 |
| 4 |  Netherlands NLDWestern Europe | 8,265 |
| 5 |  United Kingdom GBRNorthern Europe | 8,190 |
| 6 |  Belgium BELWestern Europe | 7,747 |
| 7 |  New Zealand NZLAustralia and New Zealand | 7,133 |
| 8 |  Australia AUSAustralia and New Zealand | 6,940 |
| 9 |  France FRAWestern Europe | 6,751 |
| 10 |  Sweden SWENorthern Europe | 6,582 |
| 11 |  Canada CANNorthern America | 6,382 |
| 12 |  Argentina ARGSouth America | 5,917 |
| 13 |  Germany DEUWestern Europe | 5,821 |
| 14 |  Norway NORNorthern Europe | 5,297 |
| 15 |  Austria AUTWestern Europe | 5,241 |
| 16 |  Uruguay URYSouth America | 4,838 |
| 17 |  Ireland IRLNorthern Europe | 4,737 |
| 18 |  Italy ITASouthern Europe | 4,538 |
| 19 |  Iceland ISLNorthern Europe | 4,251 |
| 20 |  Finland FINNorthern Europe | 4,114 |
| 21 |  Chile CHLSouth America | 3,904 |
| 22 |  Spain ESPSouthern Europe | 3,782 |
| 23 |  Hungary HUNEastern Europe | 3,615 |
| 24 |  Greece GRCSouthern Europe | 3,402 |
| 25 |  Japan JPNEastern Asia | 3,321 |
| 26 |  Malaysia MYSSouth-eastern Asia | 3,072 |
| 27 |  Poland POLEastern Europe | 2,906 |
| 28 |  Venezuela VENSouth America | 2,904 |
| 29 |  Portugal PRTSouthern Europe | 2,600 |
| 30 |  Guatemala GTMCentral America | 2,582 |
| 31 |  Costa Rica CRICentral America | 2,511 |
| 32 |  Honduras HNDCentral America | 2,402 |
| 33 |  Peru PERSouth America | 2,397 |
| 34 |  Panama PANCentral America | 2,383 |
| 35 |  Colombia COLSouth America | 2,308 |
| 36 |  Mexico MEXCentral America | 2,268 |
| 37 |  Singapore SGPSouth-eastern Asia | 2,246 |
| 38 |  Philippines PHLSouth-eastern Asia | 2,168 |
| 39 |  South Africa ZAFSouthern Africa | 2,128 |
| 40 |  Nicaragua NICCentral America | 2,071 |
| 41 |  Bulgaria BGREastern Europe | 2,048 |
| 42 |  Bolivia BOLSouth America | 2,040 |
| 43 |  Taiwan TWNEastern Asia | 1,997 |
| 44 |  Ecuador ECUSouth America | 1,929 |
| 45 |  Sri Lanka LKASouthern Asia | 1,918 |
| 46 |  Ghana GHAWestern Africa | 1,904 |
| 47 |  North Korea PRKEastern Asia | 1,831 |
| 48 |  Cuba CUBCaribbean | 1,758 |
| 49 |  Türkiye TURWestern Asia | 1,669 |
| 50 |  South Korea KOREastern Asia | 1,621 |
| 51 |  Indonesia IDNSouth-eastern Asia | 1,568 |
| 52 |  Romania ROUEastern Europe | 1,560 |
| 53 |  El Salvador SLVCentral America | 1,474 |
| 54 |  Myanmar MMRSouth-eastern Asia | 1,438 |
| 55 |  Russia RUSEastern Europe | 1,412 |
| 56 |  Liberia LBRWestern Africa | 1,357 |
| 57 |  Brazil BRASouth America | 1,294 |
| 58 |  India INDSouthern Asia | 1,133 |
| 59 |  Kenya KENEastern Africa | 1,078 |
| 60 |  China CHNEastern Asia | 1,015 |
| 61 |  Nigeria NGAWestern Africa | 900 |
| 62 |  Uganda UGAEastern Africa | 861 |
| 63 |  Zimbabwe ZWEEastern Africa | 852 |
| 64 |  Malawi MWIEastern Africa | 629 |
| 65 | ZambiaZMBEastern Africa | 619 |
02In 1931
At either end
The 5 countries at each end of the headline.
Highest
- 1Switzerland10,055
- 2United States9,931
- 3Denmark8,542
- 4Netherlands8,265
- 5United Kingdom8,190
A higher value is the better result. The middle country reads 2,397. “Shared” marks a value another country also holds.
031930 → 1931
Since 1930
- +1 / −0countries joined / left
- 63values changed, of 64 in both
- 15 · 48rose · fell
- 1unchanged
Rose most
- Ghana1,743 → 1,904+161
- Ireland4,618 → 4,737+119
- Malawi513 → 629+116
- North Korea1,726 → 1,831+106
- Portugal2,504 → 2,600+96
Fell most
- Canada7,669 → 6,382−1,287
- Uruguay5,950 → 4,838−1,112
- Chile4,876 → 3,904−972
- Singapore3,049 → 2,246−803
- New Zealand7,906 → 7,133−773
+ Myanmar04Caveats
Read before you use
One year of the 2023 release
Every year in this series comes from GGDC’s 2023 release, recalculated on one method, so a change from one year to the next is not a revision. It can differ from what was first published for 1931.
Nothing missing
Every one of the 65 countries has every column.
05The files
Download and cite
- .csv
For a spreadsheet or code
65 rows · 2.7 KB · UTF-8, opens in Excel
Opens with 11 lines of source notes; the table starts on row 13.
Download historical-gdp-per-capita-1931-nations-inquiry.csv - ↗
The publisher’s original
GGDC’s own file, on its own site.
421302
What this site changed: Reshaped to one row per country, with its ISO code; no value recalculated, rescaled or rounded. In full
Licence: CC BY 4.0 · what it allows, in plain words
Cite this edition
Maddison Project, Groningen Growth and Development Centre (GGDC) (1931). Historical GDP per Capita (Maddison), 1931 [data set], describing 1931. As held by Nations Inquiry, https://nationsinquiry.com/datasets/historical-gdp-per-capita/1931
06112 held
Other years
‹ The year before
Historical GDP per Capita (Maddison), 193064 countries
The year after ›
Historical GDP per Capita (Maddison), 193263 countries
All of them
Historical GDP per Capita (Maddison): every year112 held, with the data dictionary, coverage and licence.
How it has moved, charted by country