
Photo: Poco a poco derivative work: Jjtkk · CC BY-SA 3.0 · via Wikimedia Commons, shown in greyscale
Topic 07 of 18 · Country Index 2026
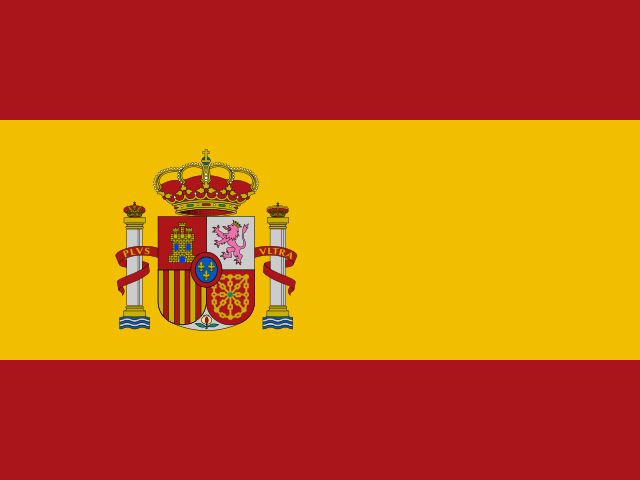
Spain: Environment & Sustainability
How much pressure does a country put on the natural world?
Spain is placed 111th of 186 countries on environment & sustainability in the Country Index 2026, from 4 of its 4 key statistics. Readings behind it: CO₂ Emissions per Capita 4.599 (2024); Water Stress 43.25 (2023).
Share
Environment & Sustainability
111th
of 186 countries placed
Placed from 4 of 4 key statistics
- 4.599CO₂ Emissions per Capita, 2024Fossil CO₂ (tonnes per person)
- 43.25Water Stress, 2023Freshwater withdrawal as a share of available resources (%)
- 12.65Organic Agricultural Area, 2024Organic share of agricultural land (%)
- 3.176Ecological Footprint, 2025Ecological Footprint (global hectares per person)
01The evidence
The 4 key statistics that decide it
Only these place Spain on environment & sustainability — one vote each. Every value is the publisher’s own, read at the edition the Country Index 2026 used; the grey ticks are every other country it was compared with, lowest on the left.
4.599
Fossil CO₂ (tonnes per person)
Lower is better
Spain: 4.599. Across the 210 countries in this edition, values run from 0.054 (DR Congo) to 41.27 (Qatar); the world median is 3.21.
- World median
- 3.21
- Best in Southern Europe
- 1.592 Albania
- Land neighbours
- Andorra 5.183 · France 3.969 · Portugal 3.409
Key 2 of 4
Water Stress
Food and Agriculture Organization of the United Nations (FAO)
2023 edition · data for 2023 · CC BY 4.0
43.25
Freshwater withdrawal as a share of available resources (%)
Lower is better
Spain: 43.25. Across the 177 countries in this edition, values run from 0.03 (Republic of the Congo) to 3,851 (Kuwait); the world median is 10.
- World median
- 10
- Best in Southern Europe
- 1.61 Croatia
- Land neighbours
- Andorra 11.91 · France 20.57 · Portugal 12.32
Key 3 of 4
Organic Agricultural Area
Food and Agriculture Organization of the United Nations (FAO)
2024 edition · data for 2024 · CC BY 4.0
12.65
Organic share of agricultural land (%)
Higher is better
Spain: 12.65. Across the 156 countries in this edition, values run from 0 (Afghanistan) to 86.38 (Samoa); the world median is 0.725.
- World median
- 0.725
- Best in Southern Europe
- 22.74 Greece
- Land neighbours
- Andorra 0.01 · France 9.53 · Portugal 21.23
3.176
Ecological Footprint (global hectares per person)
Lower is better
Spain: 3.176. Across the 126 countries in this edition, values run from 0.514 (Yemen) to 11.73 (Qatar); the world median is 2.296.
- World median
- 2.296
- Best in Southern Europe
- 2.402 Albania
- Land neighbours
- France 4.45 · Portugal 4.261
02Over time
Which way Spain is moving
Each key’s published value, edition by edition, beside the world median. The Country Index 2026 is the first edition of the standing, so the standing itself has no history to chart yet.
CO₂ Emissions per Capita
Fossil CO₂ (tonnes per person) · lower is better
SpainWorld median
Spain fell from 7.539 in 2000 to 4.599 in 2024; the world median went from 2.662 to 3.21.
Every year’s figures
Year Spain World median 2024 4.599 3.210 2023 4.497 3.145 2022 4.897 3.162 2021 4.793 3.087 2020 4.441 2.903 2019 5.285 3.273 2018 5.702 3.036 2017 5.835 3.049 2016 5.554 2.894 2015 5.789 2.846 2014 5.429 2.919 2013 5.380 2.779 2012 5.901 2.770 2011 6.027 2.748 2010 6.033 2.812 2009 6.351 2.799 2008 7.252 2.979 2007 8.051 2.593 2006 8.029 2.865 2005 8.359 2.885 2004 8.145 2.802 2003 7.894 2.918 2002 7.928 2.785 2001 7.541 2.726 2000 7.539 2.662 Water Stress
Freshwater withdrawal as a share of available resources (%) · lower is better
SpainWorld median
Spain fell from 49.22 in 2000 to 43.25 in 2023; the world median went from 10.07 to 10.
Every year’s figures
Year Spain World median 2023 43.25 10.000 2022 43.25 10.190 2021 43.25 10.460 2020 43.25 10.460 2019 39.83 10.890 2018 40.09 10.460 2017 41.03 10.460 2016 42.56 10.460 2015 42.96 10.190 2014 44.80 10.460 2013 44.10 10.460 2012 49.58 10.460 2011 47.81 10.460 2010 47.73 10.710 2009 49.24 10.960 2008 47.41 10.815 2007 47.68 11.180 2006 49.36 10.430 2005 51.04 10.250 2004 50.16 10.715 2003 49.28 10.370 2002 48.41 10.180 2001 48.82 10.130 2000 49.22 10.070 Organic Agricultural Area
Organic share of agricultural land (%) · higher is better
SpainWorld median
Spain rose from 2.14 in 2005 to 12.65 in 2024; the world median went from 0.345 to 0.725.
Every year’s figures
Year Spain World median 2024 12.65 0.725 2023 12.76 0.780 2022 10.66 0.740 2021 10.67 0.710 2020 9.33 0.665 2019 8.99 0.550 2018 8.58 0.490 2017 7.92 0.630 2016 7.69 0.545 2015 7.41 0.540 2014 6.26 0.470 2013 6.02 0.440 2012 6.52 0.480 2011 6.02 0.460 2010 5.21 0.330 2009 4.76 0.335 2008 4.01 0.290 2007 2.87 0.370 2006 2.58 0.305 2005 2.14 0.345 Ecological Footprint
Ecological Footprint (global hectares per person) · lower is better
SpainWorld median
Spain fell from 5.732 in 2000 to 3.176 in 2025; the world median went from 1.95 to 2.296.
Every year’s figures
Year Spain World median 2025 3.176 2.2963 2024 3.193 2.3139 2023 3.214 2.3174 2022 3.228 2.2724 2021 3.443 2.3370 2020 3.471 2.3057 2019 3.571 2.2578 2018 4.426 2.2485 2017 3.902 2.2209 2016 4.083 2.2308 2015 3.927 2.3000 2014 3.655 2.3814 2013 4.044 2.3363 2012 3.781 2.4200 2011 4.332 2.4794 2010 4.471 2.3679 2009 4.564 2.2224 2008 5.170 2.1727 2007 5.746 2.2036 2006 5.741 2.1203 2005 5.614 2.1512 2004 5.749 2.1055 2003 5.681 2.0449 2002 5.613 2.1195 2001 5.659 2.2004 2000 5.732 1.9499
03In context
Spain beside its neighbours
A position reads best beside the countries around it. Every position below is a place among all 186 countries on environment & sustainability, never a place within the region.
Spain and the countries it borders
Standing among all 186; the key columns are the publishers’ own values.
| Country | Standing | CO₂ Emissions per CapitaFossil CO₂ (tonnes per person) | Water StressFreshwater withdrawal as a share of available resources (%) | Organic Agricultural AreaOrganic share of agricultural land (%) | Ecological FootprintEcological Footprint (global hectares per person) |
|---|---|---|---|---|---|
 Portugalcompare | 88th | 3.409 | 12.32 | 21.23 | 4.261 |
| Spain | 111th | 4.599 | 43.25 | 12.65 | 3.176 |
 France | 114th | 3.969 | 20.57 | 9.53 | 4.45 |
 Andorra | 164th | 5.183 | 11.91 | 0.01 | — |
“—”: no published reading in that edition. What a standing is
Across Southern Europe
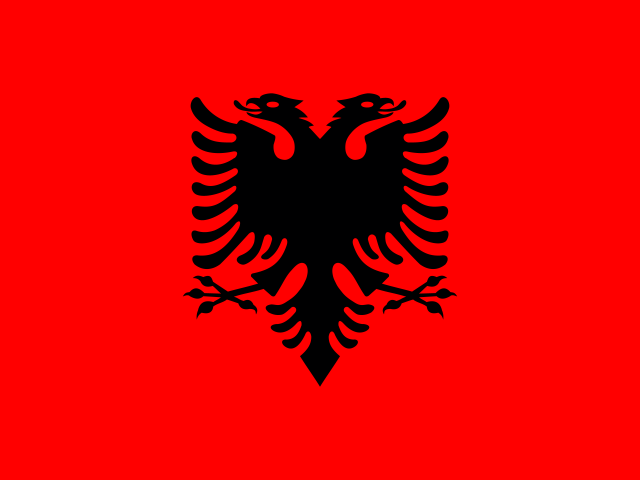
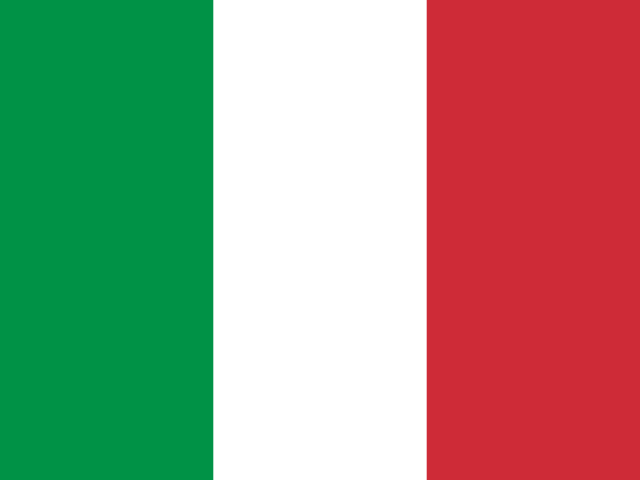
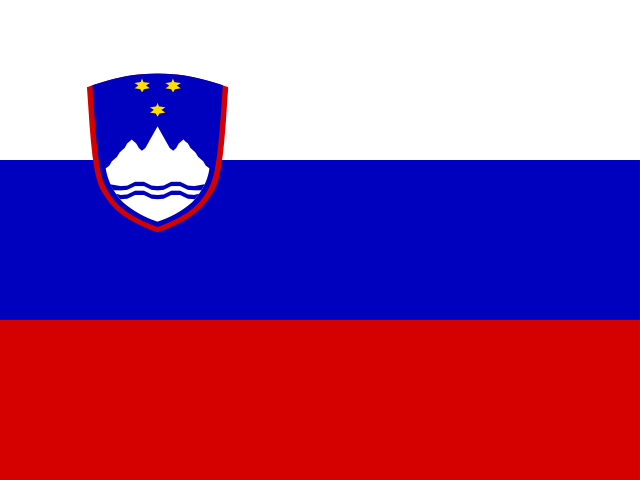
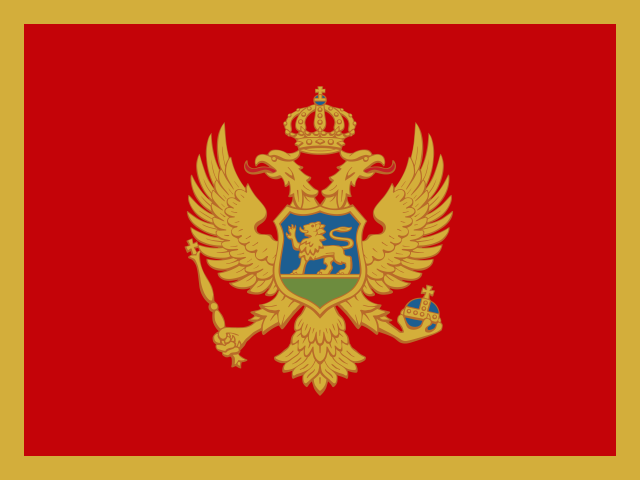
Every country in the sub-region, by its place among all 186.



Placed either side on environment & sustainability
The countries immediately above and below Spain in the topic’s list.



04Context, no vote
Where Spain is ahead of the world, and behind
46 more statistics filed under environment & sustainability, published in full and deliberately given no vote in the standing. Select a row for the publisher, the rank and the links.
Ahead of the world median15
Statistics on which Spain does better than the middle country measured.
Planetary pressures-adjusted HDIUNDP Human Development Report Office · 2023 · world median 0.6780.8180.678No real change since 2013
Spain: 0.818 · world median 0.678 · PHDI (0–1). UNDP Human Development Report Office, 2023 edition, data for 2023.
Published values in that edition run from 0.276 to 0.827; higher is better.
Position 2nd of 156 · derived.
Wind and Solar Share of Electricity GenerationEmber · 2024 · world median 5.27942.885.279▼ Worsened since 2014
Spain: 42.88 · world median 5.279 · Wind and solar (% of electricity generated). Ember, 2024 edition, data for 2024.
Published values in that edition run from 0 to 69.12; higher is better.
Climate Vulnerability (ND-GAIN)Notre Dame Global Adaptation Initiative (ND-GAIN), University of Notre Dame · 2024 · world median 0.450.3230.45No real change since 2014
Spain: 0.323 · world median 0.45 · ND-GAIN Vulnerability (0–1, where 1 is the most vulnerable). Notre Dame Global Adaptation Initiative (ND-GAIN), University of Notre Dame, 2024 edition, data for 2024.
Published values in that edition run from 0.263 to 0.655; lower is better.
Ranked 16th of 190 by Notre Dame Global Adaptation Initiative (ND-GAIN), University of Notre Dame.
Progress Toward Productive and Sustainable Agriculture (SDG 2.4.1 Proxy)FAO · 2024 · world median 3.144.143.14No real change since 2015
Spain: 4.14 · world median 3.14 · Current status score, from 1 (worst) to 5 (best), averaged over up to seven sub-indicators. Food and Agriculture Organization of the United Nations (FAO), 2024 edition, data for 2024.
Published values in that edition run from 1.67 to 4.57; higher is better.
Position 17th of 186 · derived.
World Energy Trilemma IndexWorld Energy Council · 2023 · world median 63.877.863.8No earlier reading
Spain: 77.8 · world median 63.8 · Trilemma score (0–100). World Energy Council, 2023 edition, data for 2023.
Published values in that edition run from 27.7 to 83.2; higher is better.
Ranked 13th of 99 by World Energy Council.
ND-GAIN Country IndexNotre Dame Global Adaptation Initiative (ND-GAIN), University of Notre Dame · 2024 · world median 47.4461.7147.44No real change since 2014
Spain: 61.71 · world median 47.44 · ND-GAIN Index (0–100, where 100 is best placed to adapt). Notre Dame Global Adaptation Initiative (ND-GAIN), University of Notre Dame, 2024 edition, data for 2024.
Published values in that edition run from 26.42 to 71.85; higher is better.
Ranked 29th of 190 by Notre Dame Global Adaptation Initiative (ND-GAIN), University of Notre Dame.
Annual Forest Area Change RateFAO · 2025 · world median 00.30▼ Worsened since 2015
Spain: 0.3 · world median 0 · Compound annual change in forest area over the interval ending that year (%). Food and Agriculture Organization of the United Nations (FAO), 2025 edition, data for 2025.
Published values in that edition run from -3.29 to 12.3; higher is better.
Agricultural Emissions IntensityFAO · 2023 · world median 1.5650.811.565▼ Worsened since 2013
Spain: 0.81 · world median 1.565 · Greenhouse gases from farming per value of agricultural output (kg CO₂eq per international dollar). Food and Agriculture Organization of the United Nations (FAO), 2023 edition, data for 2023.
Published values in that edition run from 0 to 28.2; lower is better.
Position 155th of 190 · derived, 1st = worst.
Carbon Intensity of ElectricityEmber · 2024 · world median 433.75146.26433.75▲ Improved since 2014
Spain: 146.26 · world median 433.75 · Carbon intensity (gCO₂e per kWh generated). Ember, 2024 edition, data for 2024.
Published values in that edition run from 23.73 to 1,306; lower is better.
Position 129th of 165 · derived, 1st = worst.
Low-Carbon Share of Electricity GenerationEmber · 2024 · world median 37.3276.7537.32▲ Improved since 2014
Spain: 76.75 · world median 37.32 · Low-carbon sources (% of electricity generated). Ember, 2024 edition, data for 2024.
Published values in that edition run from 0 to 100; higher is better.
Position 37th of 162 · derived.
Children's Climate Risk IndexUNICEF · 2020 · world median 53.75No earlier reading
Spain: 3.7 · world median 5 · Children's Climate Risk Index (0–10, higher is more risk). UNICEF, 2021 edition, data for 2020.
Published values in that edition run from 1 to 8.7; lower is better.
Ranked 117th of 163 by UNICEF (1st = worst).
PM2.5 Air Pollution ExposureAtmospheric Composition Analysis Group, Washington University in St. Louis · 2023 · world median 14.459.514.45▼ Worsened since 2013
Spain: 9.5 · world median 14.45 · Population-weighted PM2.5 concentration (µg/m³). Atmospheric Composition Analysis Group, Washington University in St. Louis, 2023 edition, data for 2023.
Published values in that edition run from 2.5 to 68.2; lower is better.
Position 159th of 220 · derived, 1st = worst.
Renewable Share of Electricity GenerationEmber · 2024 · world median 32.0657.3332.06▲ Improved since 2014
Spain: 57.33 · world median 32.06 · Renewables (% of electricity generated). Ember, 2024 edition, data for 2024.
Published values in that edition run from 0 to 100; higher is better.
Position 51st of 162 · derived.
Water-Use EfficiencyFAO · 2023 · world median 16.142.616.1No real change since 2013
Spain: 42.6 · world median 16.1 · Value added per cubic metre of freshwater withdrawn (constant US$ per m³). Food and Agriculture Organization of the United Nations (FAO), 2023 edition, data for 2023.
Published values in that edition run from 0.38 to 1,378; higher is better.
Energy Intensity of GDP (PPP)EIA · 2024 · world median 2.7382.4652.738▲ Improved since 2014
Spain: 2.465 · world median 2.738 · Energy use per dollar of GDP (thousand Btu per US$ at PPP). U.S. Energy Information Administration (EIA), 2024 edition, data for 2024.
Published values in that edition run from 0.666 to 17.45; lower is better.
Behind the world median6
Statistics on which Spain does worse than the middle country measured.
Adjusted Net SavingsWorld Bank Group · 2021 · world median 8.3897.9778.389▲ Improved since 2011
Spain: 7.977 · world median 8.389 · Adjusted net savings, including particulate emission damage (% of GNI). World Bank Group, 2021 edition, data for 2021.
Published values in that edition run from -81.62 to 32.18; higher is better.
Position 62nd of 118 · derived.
Renewable Internal Freshwater Resources per CapitaFAO · 2022 · world median 2,5282,3272,528No real change since 2012
Spain: 2,327 · world median 2,528 · Renewable internal freshwater (cubic metres per person). Food and Agriculture Organization of the United Nations (FAO), 2022 edition, data for 2022.
Published values in that edition run from 0 to 445,023; higher is better.
Position 95th of 181 · derived.
Coal Share of Electricity GenerationEmber · 2024 · world median 00.9180▲ Improved since 2014
Spain: 0.918 · world median 0 · Coal (% of electricity generated). Ember, 2024 edition, data for 2024.
Published values in that edition run from 0 to 98.25; lower is better.
World Risk IndexInstitute for International Law of Peace and Armed Conflict (IFHV), Ruhr University Bochum · 2025 · world median 4.1710.174.17No real change since 2015
Spain: 10.17 · world median 4.17 · WorldRiskIndex score (0–100, where 100 is the most at risk). Institute for International Law of Peace and Armed Conflict (IFHV), Ruhr University Bochum, 2025 edition, data for 2025.
Published values in that edition run from 0.18 to 46.56; lower is better.
Position 53rd of 193 · derived, 1st = worst.
Municipal Solid Waste GenerationWorld Bank Group · 2026 · world median 0.9661.6130.966No earlier reading
Spain: 1.613 · world median 0.966 · Municipal solid waste generated (kg per person per day). World Bank Group, 2026 edition, data for 2026.
Published values in that edition run from 0.058 to 4.176; lower is better.
Position 38th of 201 · derived, 1st = worst.
Baseline Water Stress (Aqueduct)WRI · 2019 · world median 1.6633.941.663No earlier reading
Spain: 3.94 · world median 1.663 · Baseline water stress score (0–5). World Resources Institute (WRI), 2023 edition, data for 2019.
Published values in that edition run from 0 to 5; lower is better.
No better end25
These describe the shape of a country — more is not better or worse, only different — so they are never ahead or behind.
Solar Electricity Installed CapacityEIA · 2024 · world median 0.14438.590.144No real change since 2014
Spain: 38.59 · world median 0.144 · Solar generating capacity installed (gigawatts). U.S. Energy Information Administration (EIA), 2024 edition, data for 2024.
Published values in that edition run from 0 to 886.66.
Operating Wind Power CapacityGlobal Energy Monitor · 2026 · world median 10031,007100No earlier reading
Spain: 31,007 · world median 100 · Wind farm capacity in operation (megawatts). Global Energy Monitor, 2026 edition, data for 2026.
Published values in that edition run from 0 to 542,758.
Solar Share of Electricity GenerationEmber · 2024 · world median 3.04920.753.049Moved since 2014
Spain: 20.75 · world median 3.049 · Solar (% of electricity generated). Ember, 2024 edition, data for 2024.
Published values in that edition run from 0 to 50.
Meat Supply per PersonFAO · 2023 · world median 57.83100.7957.83Moved since 2013
Spain: 100.79 · world median 57.83 · Meat available as food (kg per person per year, carcass weight). Food and Agriculture Organization of the United Nations (FAO), 2023 edition, data for 2023.
Published values in that edition run from 3.49 to 156.95.
Temperature Change on LandFAO · 2025 · world median 1.4742.3031.474Moved since 2015
Spain: 2.303 · world median 1.474 · Change in mean land-surface temperature against the country's own 1951–1980 average, °C. Food and Agriculture Organization of the United Nations (FAO), 2025 edition, data for 2025.
Published values in that edition run from 0.34 to 3.294.
Fisheries and Aquaculture ProductionFAO · 2024 · world median 52,3751,007,65952,375Moved since 2014
Spain: 1,007,659 · world median 52,375 · Fish, crustaceans, molluscs and other aquatic animals caught or farmed, tonnes (live weight). Food and Agriculture Organization of the United Nations (FAO), 2024 edition, data for 2024.
Published values in that edition run from 0 to 70,500,841.
Tree Cover LossWorld Resources Institute — Global Forest Watch (data: University of Maryland) · 2025 · world median 3,775162,7963,775Moved since 2015
Spain: 162,796 · world median 3,775 · Tree cover loss (hectares, where canopy cover exceeded 30% in 2000). World Resources Institute — Global Forest Watch (data: University of Maryland), 2025 edition, data for 2025.
Published values in that edition run from 0 to 6,225,187.
Land Under Cereal ProductionFAO · 2023 · world median 689,2785,444,490689,278No real change since 2013
Spain: 5,444,490 · world median 689,278 · Land under cereal production (hectares). Food and Agriculture Organization of the United Nations (FAO), 2023 edition, data for 2023.
Published values in that edition run from 0 to 103,715,108.
Position 30th of 179 · derived, counted from the highest value.
Agricultural EmissionsFAO · 2023 · world median 8,63548,4938,635No real change since 2013
Spain: 48,493 · world median 8,635 · Farm-gate emissions (kt CO₂eq). Food and Agriculture Organization of the United Nations (FAO), 2023 edition, data for 2023.
Published values in that edition run from 0 to 1,044,508.
Position 33rd of 193 · derived, counted from the highest value.
Agricultural Irrigated LandFAO · 2023 · world median 3.6615.123.66No earlier reading
Spain: 15.12 · world median 3.66 · Irrigated share of agricultural land (%). Food and Agriculture Organization of the United Nations (FAO), 2023 edition, data for 2023.
Published values in that edition run from 0.003 to 89.04.
Position 23rd of 121 · derived, counted from the highest value.
Methane EmissionsEDGAR · 2025 · world median 325.691,574325.69No real change since 2015
Spain: 1,574 · world median 325.69 · Methane emissions (gigagrams of CH₄). European Commission, Joint Research Centre (EDGAR), 2025 edition, data for 2025.
Published values in that edition run from 0.048 to 51,093.
Consumption-Based CO₂ EmissionsGlobal Carbon Project · 2023 · world median 12.7971.1312.79Moved since 2013
Spain: 71.13 · world median 12.79 · Consumption-based fossil CO₂ (million tonnes of carbon). Global Carbon Project, 2023 edition, data for 2023.
Published values in that edition run from 0.882 to 2,963.
Arable Land per PersonFAO · 2023 · world median 0.1090.2380.109No real change since 2013
Spain: 0.238 · world median 0.109 · Arable land (hectares per person). Food and Agriculture Organization of the United Nations (FAO), 2023 edition, data for 2023.
Published values in that edition run from 0 to 1.459.
Position 44th of 206 · derived, counted from the highest value.
Burned AreaGWIS · 2025 · world median 13,824369,96413,824Moved since 2015
Spain: 369,964 · world median 13,824 · Burned area (hectares). European Commission Joint Research Centre — Global Wildfire Information System (GWIS), 2025 edition, data for 2025.
Published values in that edition run from 0 to 50,562,035.
Cropland Nitrogen BalanceFAO · 2023 · world median 37.6362.8237.63Moved since 2013
Spain: 62.82 · world median 37.63 · Nitrogen surplus (+) or deficit (−) on cropland, kg per hectare. Food and Agriculture Organization of the United Nations (FAO), 2023 edition, data for 2023.
Published values in that edition run from -555.52 to 1,199.
Agricultural LandFAO · 2023 · world median 37.9649.5837.96Moved since 2013
Spain: 49.58 · world median 37.96 · Agricultural land (% of land area). Food and Agriculture Organization of the United Nations (FAO), 2023 edition, data for 2023.
Published values in that edition run from 0.445 to 86.48.
Position 62nd of 209 · derived, counted from the highest value.
Environmentally Related Tax RevenueOECD · 2024 · world median 1.0751.5431.075No real change since 2014
Spain: 1.543 · world median 1.075 · Environmentally related tax revenue (% of GDP). OECD, 2024 edition, data for 2024.
Published values in that edition run from 0 to 3.346.
Pesticide Use per HectareFAO · 2024 · world median 1.733.631.73Moved since 2014
Spain: 3.63 · world median 1.73 · Pesticide use (kg per hectare of cropland). Food and Agriculture Organization of the United Nations (FAO), 2024 edition, data for 2024.
Published values in that edition run from 0 to 37.72.
Position 65th of 178 · derived, counted from the highest value.
Fertilizer Consumption per HectareFAO · 2023 · world median 87.36115.1487.36Moved since 2013
Spain: 115.14 · world median 87.36 · Fertilizer consumption (kg per hectare of arable land). Food and Agriculture Organization of the United Nations (FAO), 2023 edition, data for 2023.
Published values in that edition run from 0 to 2,926.
Position 72nd of 188 · derived, counted from the highest value.
Forest AreaFAO · 2023 · world median 31.0837.1931.08No real change since 2013
Spain: 37.19 · world median 31.08 · Forest area (% of land area). Food and Agriculture Organization of the United Nations (FAO), 2023 edition, data for 2023.
Published values in that edition run from 0 to 94.45.
Position 82nd of 210 · derived, counted from the highest value.
Livestock DensityFAO · 2023 · world median 0.5350.630.535Moved since 2013
Spain: 0.63 · world median 0.535 · Livestock units per hectare of agricultural land. Food and Agriculture Organization of the United Nations (FAO), 2023 edition, data for 2023.
Published values in that edition run from 0.02 to 43.97.
Position 79th of 188 · derived, counted from the highest value.
Population Living Below 5 m ElevationCenter for International Earth Science Information Network (CIESIN), Columbia University · 2015 · world median 2.9543.9982.954No real change since 1990
Spain: 3.998 · world median 2.954 · Population living below 5 m elevation (% of total population). Center for International Earth Science Information Network (CIESIN), Columbia University, 2015 edition, data for 2015.
Published values in that edition run from 0 to 78.48.
Water Withdrawal by SectorFAO · 2022 · world median 62.1465.3362.14Moved since 2012
Spain: 65.33 · world median 62.14 · Freshwater withdrawn for agriculture (% of total). Food and Agriculture Organization of the United Nations (FAO), 2022 edition, data for 2022.
Published values in that edition run from 0 to 99.48.
Position 82nd of 171 · derived, counted from the highest value.
Operating Coal Power CapacityGlobal Energy Monitor · 2026 · world median 525260525No earlier reading
Spain: 260 · world median 525 · Coal-fired capacity in operation (megawatts). Global Energy Monitor, 2026 edition, data for 2026.
Published values in that edition run from 0 to 1,263,101.
Total Natural Resources Rents (% of GDP)World Bank Group · 2021 · world median 1.7080.1151.708Moved since 2011
Spain: 0.115 · world median 1.708 · Natural resources rents (% of GDP). World Bank Group, 2021 edition, data for 2021.
Published values in that edition run from 0 to 61.03.
Position 149th of 180 · derived, counted from the highest value.
No current reading for Spain
Forest Area within Legally Established Protected Areas (last 2020), Mangrove Area and Tropical Moist Forest Deforestation. Listed rather than hidden, so the page can be checked against it.
“Position · derived” is this site’s ordering of the published values, 1st = best unless the row says otherwise; the publisher ranks no country on it. Rank, position and standing
05Country Index 2026
Environment & Sustainability among Spain’s 16 topics
Environment & Sustainability is Spain’s 16th best-placed topic of 16. Strongest first, each marker at its share of that topic’s field.
- Digital & Technologyjoint 11th of 1984/4 keys
- Gender & Equalityjoint 12th of 1834/4 keys
- Health & Wellbeing14th of 2003/4 keys
- Economy & Innovation16th of 1764/4 keys
- Governance & Institutionsjoint 23rd of 1944/4 keys
- Development & Human Capitaljoint 27th of 1963/3 keys
- Energy25th of 1653/3 keys
- Education & Knowledge34th of 1983/4 keys
- Democracy & Civil Libertiesjoint 38th of 1984/4 keys
- Mobility & Trade35th of 1774/4 keys
- Risk & Resilience51st of 1934/4 keys
- Peace & Security48th of 1774/4 keys
- Food & Agriculturejoint 50th of 1844/4 keys
- Poverty & Inequality54th of 1593/3 keys
- Work & Labour77th of 1824/4 keys
- Environment & Sustainability111th of 1864/4 keys
06The top of the list
Who leads on environment & sustainability
The three countries placed highest of 186, and the leaders Spain can most readily be measured against.
 1
 Angola
Middle Africa
1st of 186 · 3 of 4 keys
Photo: Paulo César Santos derivative work: Jjtkk · CC0, greyscale
- 2
 São Tomé and Príncipe
Middle Africa
2nd of 186 · 3 of 4 keys
 3
 Sierra Leone
Western Africa
3rd of 186 · 4 of 4 keys
Photo: Annabel Symington derivative work: Jjtkk · CC BY 2.0, greyscale
Placed highest nearby
Highest in Europe
 Liechtenstein27th2/4 keys
Highest in Southern Europe
 Croatia82nd4/4 keys
This page
Spain111th4/4 keys
Positions out of 186 placed on the topic. A country needs readings on enough keys to be placed, and the top of the list is often held on fewer of them.
07Questions
Spain on environment & sustainability: questions answered
Every answer is built from the numbers on this page, so none can say something the page does not.
How does Spain rank on environment & sustainability?
Spain is placed 111th of 186 countries on Environment & Sustainability in the Country Index 2026, from 4 of its 4 key statistics (CO₂ Emissions per Capita, Water Stress, Organic Agricultural Area and Ecological Footprint). The position is this site’s ordering of published statistics, not a rank any publisher printed.
What is the latest CO₂ Emissions per Capita figure for Spain?
4.599 in 2024 (fossil CO₂ (tonnes per person)), according to Global Carbon Project. The world median in the same edition was 3.21.
What is the latest Water Stress figure for Spain?
43.25 in 2023 (freshwater withdrawal as a share of available resources (%)), according to Food and Agriculture Organization of the United Nations (FAO). The world median in the same edition was 10.
How does Spain compare with France on environment & sustainability?
France is placed 114th of 186, and Spain 111th. CO₂ Emissions per Capita: France 3.969, Spain 4.599; Water Stress: France 20.57, Spain 43.25; Organic Agricultural Area: France 9.53, Spain 12.65; Ecological Footprint: France 4.45, Spain 3.176.
How have Spain’s environment & sustainability figures changed?
CO₂ Emissions per Capita fell from 7.539 in 2000 to 4.599 in 2024; Water Stress fell from 49.22 in 2000 to 43.25 in 2023; Organic Agricultural Area rose from 2.14 in 2005 to 12.65 in 2024; Ecological Footprint fell from 5.732 in 2000 to 3.176 in 2025.
Which environment & sustainability statistics are missing for Spain?
No current reading is published for Spain on Forest Area within Legally Established Protected Areas, Mangrove Area and Tropical Moist Forest Deforestation. They are listed rather than hidden, so the evidence on the page can be checked against it.
08Method
Method, sources and how to cite
What this topic does not measure
Air quality and biodiversity are not keys, because the site does not yet hold data for them that passes every test. Forest cover, farmland, farm emissions and the renewable share of electricity are published here as context. Exposure to natural hazards belongs to Risk & Resilience.
How the Environment & Sustainability standing is decided
A standing is this site’s ordering, named with its edition — never a publisher’s rank. 4 key statistics vote, one vote each; every country’s published value becomes a place within that key’s own field, the places are averaged, and the average is never published. A country needs 2 of the 4 keys to be placed.
The environment & sustainability method, step by stepHow every standing on this site is built
The key statistics and their licences
- CO₂ Emissions per Capita — Global Carbon Project, CC BY 4.0
- Water Stress — Food and Agriculture Organization of the United Nations (FAO), CC BY 4.0
- Organic Agricultural Area — Food and Agriculture Organization of the United Nations (FAO), CC BY 4.0
- Ecological Footprint — Global Footprint Network, CC BY-SA 4.0
The other 46 statistics on this page come from 18 publishers, each named beside its numbers, with every edition and licence on the datasets pages.
The standing itself is part of the Country Index 2026, published under CC BY-SA 4.0.
Photographs
Spain’s banner and the countries placed highest, from their profiles: Wikimedia Commons, shown in greyscale, each used under the licence named.
- Spain (banner) — Poco a poco derivative work: Jjtkk, CC BY-SA 3.0
- Angola — Paulo César Santos derivative work: Jjtkk, CC0
- Sierra Leone — Annabel Symington derivative work: Jjtkk, CC BY 2.0
Cite this page
Nations Inquiry (2026). Spain: Environment & Sustainability — standing and statistics, Country Index 2026. https://nationsinquiry.com/countries/spain/environment