
Photo: Slashme · CC BY-SA 3.0 · via Wikimedia Commons, shown in greyscale
Topic 02 of 18 · Country Index 2026

Nigeria: Economy & Innovation
What does an economy do for the people inside it?
Nigeria is placed 136th of 176 countries on economy & innovation in the Country Index 2026, from 4 of its 4 key statistics. Readings behind it: GDP per Capita (PPP) 8,145 (2025); Firms with a Bank Loan or Line of Credit 20.82 (2025).
Share
Economy & Innovation
136th
of 176 countries placed
Placed from 4 of 4 key statistics
- 8,145GDP per Capita (PPP), 2025GDP per capita (constant 2021 international $, PPP)
- 20.82Firms with a Bank Loan or Line of Credit, 2025Firms with a bank loan or line of credit (%)
- -2.281Economic Complexity Index, 2024ECI score (standardised, roughly −3 to +3)
- 63.26Account Ownership at a Financial Institution, 2024Adults with an account (% of population aged 15+)
01The evidence
The 4 key statistics that decide it
Only these place Nigeria on economy & innovation — one vote each. Every value is the publisher’s own, read at the edition the Country Index 2026 used — or, for a survey-based key, each country’s latest reading; the grey ticks are every other country it was compared with, lowest on the left.
8,145
GDP per capita (constant 2021 international $, PPP)
Higher is better
Nigeria: 8,145. Across the 185 countries in this edition, values run from 1,067 (Burundi) to 139,593 (Singapore); the world median is 17,265.
- World median
- 17,265
- Best in Western Africa
- 10,396 Cabo Verde
- Land neighbours
- Benin 4,116 · Cameroon 4,946 · Niger 1,861 · Chad 2,481
Key 2 of 4
Firms with a Bank Loan or Line of Credit
World Bank Group
Latest reading per country, 2016–2025 · Nigeria’s is from 2025 · CC BY 4.0
20.82
Firms with a bank loan or line of credit (%)
Higher is better
Nigeria: 20.82. Across the 179 countries at their latest reading, values run from 2.113 (Pakistan) to 88.52 (Israel); the world median is 35.95.
- World median
- 35.95
- Best in Western Africa
- 47.24 Togo
- Land neighbours
- Benin 40.87 · Cameroon 52.24 · Niger 16.43 · Chad 9.312
Key 3 of 4
Economic Complexity Index
Growth Lab at Harvard University
2024 edition · data for 2024 · CC0 1.0
-2.281
ECI score (standardised, roughly −3 to +3)
Higher is better
Ranked 140th of 145 by Growth Lab at Harvard University
Nigeria: -2.281. Across the 145 countries in this edition, values run from -3.53 (Chad) to 1.729 (Japan); the world median is 0.131.
- World median
- 0.131
- Best in Western Africa
- -0.507 Senegal
- Land neighbours
- Benin -0.98 · Cameroon -1.594 · Niger -0.835 · Chad -3.53
Key 4 of 4
Account Ownership at a Financial Institution
World Bank Group
2024 edition · data for 2024 · CC BY 4.0
63.26
Adults with an account (% of population aged 15+)
Higher is better
Nigeria: 63.26. Across the 139 countries in this edition, values run from 14.83 (Niger) to 99.85 (Iceland); the world median is 72.83.
- World median
- 72.83
- Best in Western Africa
- 81.24 Ghana
- Land neighbours
- Benin 51.84 · Cameroon 60.87 · Niger 14.83 · Chad 20.9
02Over time
Which way Nigeria is moving
Each key’s published value, edition by edition, beside the world median. The Country Index 2026 is the first edition of the standing, so the standing itself has no history to chart yet.
GDP per Capita (PPP)
GDP per capita (constant 2021 international $, PPP) · higher is better
NigeriaWorld median
Nigeria rose from 4,889 in 2000 to 8,145 in 2025; the world median went from 10,589 to 17,265.
Every year’s figures
Year Nigeria World median 2025 8,145 17,265 2024 7,994 18,108 2023 7,843 17,686 2022 7,752 16,933 2021 7,588 16,260 2020 7,664 15,631 2019 8,362 16,761 2018 8,363 16,349 2017 8,397 16,129 2016 8,535 15,512 2015 8,892 14,857 2014 8,885 14,475 2013 8,581 14,681 2012 8,266 14,631 2011 8,154 13,916 2010 7,963 14,101 2009 7,581 13,655 2008 7,216 14,030 2007 6,949 13,755 2006 6,703 12,983 2005 6,497 12,023 2004 6,275 11,608 2003 5,905 11,183 2002 5,655 11,144 2001 5,040 10,907 2000 4,889 10,589 Economic Complexity Index
ECI score (standardised, roughly −3 to +3) · higher is better
NigeriaWorld median
Nigeria rose from -2.464 in 2000 to -2.281 in 2024; the world median went from 0.016 to 0.131.
Every year’s figures
Year Nigeria World median 2024 -2.281 0.1310 2023 -2.297 0.0710 2022 -2.400 0.0580 2021 -2.050 0.0010 2020 -2.054 0.0470 2019 -1.989 0.0300 2018 -2.198 -0.0150 2017 -2.266 0.0080 2016 -2.106 -0.0660 2015 -1.700 -0.0600 2014 -1.584 -0.0190 2013 -1.987 0.0140 2012 -2.311 0.0060 2011 -1.780 -0.0140 2010 -1.896 -0.0020 2009 -1.650 0.0990 2008 -1.807 0.0700 2007 -1.763 -0.0080 2006 -2.291 0.0740 2005 -2.807 0.0510 2004 -2.901 0.0505 2003 -1.962 0.0450 2002 -1.976 0.0100 2001 -2.457 0.0470 2000 -2.464 0.0160 Account Ownership at a Financial Institution
Adults with an account (% of population aged 15+) · higher is better
NigeriaWorld median
Nigeria rose from 29.67 in 2011 to 63.26 in 2024; the world median went from 37.03 to 72.83.
Every year’s figures
Year Nigeria World median 2024 63 73 2021 45 74 2017 40 59 2014 44 52 2011 30 37
03In context
Nigeria beside its neighbours
A position reads best beside the countries around it. Every position below is a place among all 176 countries on economy & innovation, never a place within the region.
Nigeria and the countries it borders
Standing among all 176; the key columns are the publishers’ own values.
| Country | Standing | GDP per Capita (PPP)GDP per capita (constant 2021 international $, PPP) | Firms with a Bank Loan or Line of CreditFirms with a bank loan or line of credit (%) | Economic Complexity IndexECI score (standardised, roughly −3 to +3) | Account Ownership at a Financial InstitutionAdults with an account (% of population aged 15+) |
|---|---|---|---|---|---|
 Cameroon | 116th | 4,946 | 52.24 | -1.594 | 60.87 |
 Benin | 124th | 4,116 | 40.87 | -0.98 | 51.84 |
| Nigeria | 136th | 8,145 | 20.82 | -2.281 | 63.26 |
 Niger | 166th | 1,861 | 16.43 | -0.835 | 14.83 |
 Chad | 175th | 2,481 | 9.312 | -3.53 | 20.9 |
“—”: no published reading in that edition. What a standing is
Across Western Africa
Every country in the sub-region, by its place among all 176.












Placed either side on economy & innovation
The countries immediately above and below Nigeria in the topic’s list.






04Context, no vote
Where Nigeria is ahead of the world, and behind
49 more statistics filed under economy & innovation, published in full and deliberately given no vote in the standing. Select a row for the publisher, the rank and the links.
Ahead of the world median9
Statistics on which Nigeria does better than the middle country measured.
Adjusted Net SavingsWorld Bank Group · 2021 · world median 8.38918.468.389▲ Improved since 2011
Nigeria: 18.46 · world median 8.389 · Adjusted net savings, including particulate emission damage (% of GNI). World Bank Group, 2021 edition, data for 2021.
Published values in that edition run from -81.62 to 32.18; higher is better.
Position 21st of 118 · derived.
Crop Production IndexFAO · 2022 · world median 106.23120.89106.23▲ Improved since 2012
Nigeria: 120.89 · world median 106.23 · Crop production index (2014–2016 = 100). Food and Agriculture Organization of the United Nations (FAO), 2022 edition, data for 2022.
Published values in that edition run from 53.79 to 189.93; higher is better.
Position 46th of 195 · derived.
Food Production IndexFAO · 2022 · world median 106.08119.85106.08▲ Improved since 2012
Nigeria: 119.85 · world median 106.08 · Food production index (2014–2016 = 100). Food and Agriculture Organization of the United Nations (FAO), 2022 edition, data for 2022.
Published values in that edition run from 71.08 to 177.49; higher is better.
Position 46th of 195 · derived.
Liner Shipping Connectivity IndexUNCTAD · 2026 · world median 56.21116.0456.21No real change since 2016
Nigeria: 116.04 · world median 56.21 · LSCI (index, average Q1 2023 = 100). UN Trade and Development (UNCTAD), 2026 edition, data for 2026.
Published values in that edition run from 4.13 to 1,319; higher is better.
Ranked 49th of 175 by UNCTAD.
Water-Use EfficiencyFAO · 2023 · world median 16.133.8416.1No real change since 2013
Nigeria: 33.84 · world median 16.1 · Value added per cubic metre of freshwater withdrawn (constant US$ per m³). Food and Agriculture Organization of the United Nations (FAO), 2023 edition, data for 2023.
Published values in that edition run from 0.38 to 1,378; higher is better.
Digitally-Deliverable Services ExportsUNCTAD · 2024 · world median 25.4233.9625.42▲ Improved since 2014
Nigeria: 33.96 · world median 25.42 · Digitally-deliverable services exports (% of services exports). UN Trade and Development (UNCTAD), 2024 edition, data for 2024.
Published values in that edition run from 0.377 to 87.15; higher is better.
Position 61st of 170 · derived.
Government AI Readiness IndexOxford Insights · 2025 · world median 40.1950.7940.19▲ Improved since 2020
Nigeria: 50.79 · world median 40.19 · AI readiness score (0–100). Oxford Insights, 2025 edition, data for 2025.
Published values in that edition run from 12.12 to 88.36; higher is better.
Ranked 70th of 195 by Oxford Insights.
GDP GrowthWorld Bank Group · 2025 · world median 3.3964.0133.396▲ Improved since 2015
Nigeria: 4.013 · world median 3.396 · GDP growth (annual %). World Bank Group, 2025 edition, data for 2025.
Published values in that edition run from -5.847 to 19.34; higher is better.
Position 71st of 186 · derived.
Livestock Production IndexFAO · 2022 · world median 107.06112.91107.06▲ Improved since 2012
Nigeria: 112.91 · world median 107.06 · Livestock production index (2014–2016 = 100). Food and Agriculture Organization of the United Nations (FAO), 2022 edition, data for 2022.
Published values in that edition run from 35.52 to 190.08; higher is better.
Position 75th of 194 · derived.
Behind the world median21
Statistics on which Nigeria does worse than the middle country measured.
Management Practices IndexWorld Bank Group · 2026 · world median 52.3951.5352.39No earlier reading
Nigeria: 51.53 · world median 52.39 · Management practices index, medium and large firms (0–100). World Bank Group, 2026 edition, data for 2026.
Published values in that edition run from 28.07 to 69.29; higher is better.
Position 92nd of 169 · derived.
Firms with an International Quality CertificationWorld Bank Group · 2026 · world median 10.48.72910.4No earlier reading
Nigeria: 8.729 · world median 10.4 · Firms with an internationally recognised quality certification (%). World Bank Group, 2026 edition, data for 2026.
Published values in that edition run from 0 to 45.77; higher is better.
Frontier Technology Readiness IndexUNCTAD · 2023 · world median 0.4850.3930.485▲ Improved since 2013
Nigeria: 0.393 · world median 0.485 · Frontier Technology Readiness Index (0–1). UN Trade and Development (UNCTAD), 2023 edition, data for 2023.
Published values in that edition run from 0 to 1; higher is better.
Position 106th of 170 · derived.
Logistics Performance IndexWorld Bank Group · 2023 · world median 2.92.62.9▼ Worsened since 2014
Nigeria: 2.6 · world median 2.9 · LPI score (1–5). World Bank Group, 2023 edition, data for 2023.
Published values in that edition run from 1.9 to 4.3; higher is better.
Ranked 88th of 139 by World Bank Group.
ICT Services ExportsUNCTAD · 2024 · world median 7.4744.0387.474▲ Improved since 2014
Nigeria: 4.038 · world median 7.474 · ICT services exports (% of services exports). UN Trade and Development (UNCTAD), 2024 edition, data for 2024.
Published values in that edition run from 0 to 56.25; higher is better.
Position 81st of 118 · derived.
External Debt Stocks (% of GNI)World Bank Group · 2024 · world median 43.9460.0443.94▼ Worsened since 2014
Nigeria: 60.04 · world median 43.94 · External debt stocks (% of GNI). World Bank Group, 2024 edition, data for 2024.
Published values in that edition run from 2.213 to 350.57; lower is better.
Position 35th of 110 · derived, 1st = worst.
Comprehensive Wealth per CapitaWorld Bank Group · 2020 · world median 46,48621,24946,486▼ Worsened since 2010
Nigeria: 21,249 · world median 46,486 · National comprehensive wealth per person (real chained 2019 US$). World Bank Group, 2020 edition, data for 2020.
Published values in that edition run from 4,276 to 1,246,092; higher is better.
Position 104th of 150 · derived.
Regulatory QualityWorld Bank Group · 2025 · world median -0.093-0.646-0.093▲ Improved since 2015
Nigeria: -0.646 · world median -0.093 · Regulatory Quality (−2.5 to 2.5). World Bank Group, 2025 edition, data for 2025.
Published values in that edition run from -2.106 to 2.113; higher is better.
Position 152nd of 209 · derived.
Historical GDP per Capita (Maddison)GGDC · 2022 · world median 12,8905,07012,890▼ Worsened since 2012
Nigeria: 5,070 · world median 12,890 · GDP per capita (2011 international $). Maddison Project, Groningen Growth and Development Centre (GGDC), 2022 edition, data for 2022.
Published values in that edition run from 596.39 to 149,171; higher is better.
Position 122nd of 166 · derived.
Debt Service on External DebtWorld Bank Group · 2024 · world median 12.9321.9112.93▼ Worsened since 2014
Nigeria: 21.91 · world median 12.93 · Total debt service (% of exports of goods, services and primary income). World Bank Group, 2024 edition, data for 2024.
Published values in that edition run from 0.285 to 96.2; lower is better.
Position 29th of 109 · derived, 1st = worst.
Global Innovation IndexWorld Intellectual Property Organization · 2025 · world median 28.5221.0828.52▲ Improved since 2022
Nigeria: 21.08 · world median 28.52 · GII score (0–100). World Intellectual Property Organization, 2025 edition, data for 2025.
Published values in that edition run from 11.94 to 65.96; higher is better.
Ranked 105th of 139 by World Intellectual Property Organization.
Firms Competing Against Informal FirmsWorld Bank Group · 2026 · world median 41.8156.3641.81No earlier reading
Nigeria: 56.36 · world median 41.81 · Firms competing against unregistered or informal firms (%). World Bank Group, 2026 edition, data for 2026.
Published values in that edition run from 1.926 to 90.5; lower is better.
Position 45th of 181 · derived, 1st = worst.
Interest Payments on External DebtWorld Bank Group · 2024 · world median 1.4512.6921.451▼ Worsened since 2014
Nigeria: 2.692 · world median 1.451 · Interest payments on external debt (% of GNI). World Bank Group, 2024 edition, data for 2024.
Published values in that edition run from 0.069 to 17.92; lower is better.
Position 25th of 112 · derived, 1st = worst.
Actual Individual Consumption per Capita (PPP)World Bank Group · 2021 · world median 12,8003,73112,800▼ Worsened since 2017
Nigeria: 3,731 · world median 12,800 · Actual individual consumption per capita (PPP, current international $). World Bank Group, 2021 edition, data for 2021.
Published values in that edition run from 688.7 to 52,654; higher is better.
Position 140th of 173 · derived.
Productive Capacities IndexUNCTAD · 2022 · world median 46.6730.1746.67▲ Improved since 2012
Nigeria: 30.17 · world median 46.67 · Productive Capacities Index (1–100). UN Trade and Development (UNCTAD), 2022 edition, data for 2022.
Published values in that edition run from 17.8 to 71.02; higher is better.
Position 166th of 195 · derived.
Total Factor Productivity LevelGGDC · 2023 · world median 0.6270.2680.627▼ Worsened since 2013
Nigeria: 0.268 · world median 0.627 · TFP level at current PPPs (USA = 1). Groningen Growth and Development Centre (GGDC), 2023 edition, data for 2023.
Published values in that edition run from 0.052 to 1.192; higher is better.
Researchers per Million InhabitantsUIS · 2024 · world median 701.9522.12701.95No earlier reading
Nigeria: 22.12 · world median 701.95 · Researchers per million inhabitants (full-time equivalent). UNESCO Institute for Statistics (UIS), 2024 edition, data for 2024.
Published values in that edition run from 1.446 to 18,130; higher is better.
Position 139th of 145 · derived.
World Energy Trilemma IndexWorld Energy Council · 2023 · world median 63.839.263.8No earlier reading
Nigeria: 39.2 · world median 63.8 · Trilemma score (0–100). World Energy Council, 2023 edition, data for 2023.
Published values in that edition run from 27.7 to 83.2; higher is better.
Ranked 94th of 99 by World Energy Council.
Average Monthly Earnings of EmployeesILO · 2024 · world median 1,636288.051,636No real change since 2019
Nigeria: 288.05 · world median 1,636 · Average monthly earnings of employees (2021 PPP $). International Labour Organization (ILO), 2024 edition, data for 2024.
Published values in that edition run from 193.28 to 9,307; higher is better.
Position 74th of 75 · derived.
Informal Output (DGE Model Estimate)World Bank Group (Prospects Group) · 2020 · world median 27.554.8827.5No real change since 2010
Nigeria: 54.88 · world median 27.5 · Informal output, model estimate (% of official GDP). World Bank Group (Prospects Group), 2020 edition, data for 2020.
Published values in that edition run from 7.91 to 60.43; lower is better.
ICT Goods ExportsUNCTAD · 2024 · world median 0.97500.975No real change since 2014
Nigeria: 0 · world median 0.975 · ICT goods exports (% of total goods exports). UN Trade and Development (UNCTAD), 2024 edition, data for 2024.
Published values in that edition run from 0 to 61.45; higher is better.
Position 119th of 119 · derived.
No better end19
These describe the shape of a country — more is not better or worse, only different — so they are never ahead or behind.
Commodity Export DependenceUNCTAD · 2024 · world median 67.1796.6867.17No real change since 2014
Nigeria: 96.68 · world median 67.17 · Commodity exports (% of merchandise exports, three-year average). UN Trade and Development (UNCTAD), 2024 edition, data for 2024.
Published values in that edition run from 4.605 to 99.77.
Inflation, GDP DeflatorWorld Bank Group · 2025 · world median 3.30613.863.306Moved since 2015
Nigeria: 13.86 · world median 3.306 · Annual change in the GDP implicit deflator (%). World Bank Group, 2025 edition, data for 2025.
Published values in that edition run from -7.93 to 227.09.
Export Concentration IndexUNCTAD · 2025 · world median 0.3060.6190.306Moved since 2015
Nigeria: 0.619 · world median 0.306 · Export concentration index (0–1, normalised Herfindahl–Hirschman). UN Trade and Development (UNCTAD), 2025 edition, data for 2025.
Published values in that edition run from 0.059 to 0.933.
Statutory Corporate Income Tax RateOECD · 2026 · world median 243024Moved since 2016
Nigeria: 30 · world median 24 · Combined statutory corporate income tax rate, central and sub-central government (%). OECD, 2026 edition, data for 2026.
Published values in that edition run from 0 to 36.13.
Scholarly ArticlesOurResearch · 2025 · world median 2,24052,1232,240No real change since 2022
Nigeria: 52,123 · world median 2,240 · Articles with at least one author at an institution in the country (full counting). OpenAlex (OurResearch), 2025 edition, data for 2025.
Published values in that edition run from 1 to 1,094,890.
Agriculture, Forestry and Fishing Value Added (% of GDP)World Bank Group · 2025 · world median 6.57222.986.572Moved since 2015
Nigeria: 22.98 · world median 6.572 · Agriculture, forestry and fishing value added (% of GDP). World Bank Group, 2025 edition, data for 2025.
Published values in that edition run from 0.025 to 47.59.
Position 22nd of 158 · derived, counted from the highest value.
Merchant Fleet by Country of OwnershipUNCTAD · 2026 · world median 275.7310,130275.73Moved since 2016
Nigeria: 10,130 · world median 275.73 · Merchant fleet owned (thousand dead-weight tons). UN Trade and Development (UNCTAD), 2026 edition, data for 2026.
Published values in that edition run from 0 to 397,071.
Tariff Rate, Applied, Weighted Mean, All ProductsWorld Bank Group · 2022 · world median 3.669.343.66Moved since 2013
Nigeria: 9.34 · world median 3.66 · Applied tariff rate, trade-weighted mean (%). World Bank Group, 2022 edition, data for 2022.
Published values in that edition run from 0 to 29.52.
Terms of Trade IndexUNCTAD · 2025 · world median 103.23124.65103.23Moved since 2015
Nigeria: 124.65 · world median 103.23 · Terms of trade index (2015 = 100). UN Trade and Development (UNCTAD), 2025 edition, data for 2025.
Published values in that edition run from 38.2 to 1,448.
Total Natural Resources Rents (% of GDP)World Bank Group · 2021 · world median 1.7088.5531.708Moved since 2011
Nigeria: 8.553 · world median 1.708 · Natural resources rents (% of GDP). World Bank Group, 2021 edition, data for 2021.
Published values in that edition run from 0 to 61.03.
Position 50th of 180 · derived, counted from the highest value.
Foreign Direct Investment InflowsUNCTAD · 2025 · world median 1.9681.3771.968Moved since 2015
Nigeria: 1.377 · world median 1.968 · FDI inflows (% of GDP). UN Trade and Development (UNCTAD), 2025 edition, data for 2025.
Published values in that edition run from -32.97 to 2,221.
Manufacturing Value Added (% of GDP)World Bank Group · 2025 · world median 11.268.25711.26Moved since 2015
Nigeria: 8.257 · world median 11.26 · Manufacturing value added (% of GDP). World Bank Group, 2025 edition, data for 2025.
Published values in that edition run from 0.481 to 43.97.
Position 92nd of 132 · derived, counted from the highest value.
Price Level of Household ConsumptionGGDC · 2023 · world median 0.5230.3630.523Moved since 2013
Nigeria: 0.363 · world median 0.523 · Price level of household consumption (US output price level in 2021 = 1). Groningen Growth and Development Centre (GGDC), 2023 edition, data for 2023.
Published values in that edition run from 0.177 to 65.54.
Statutory Minimum WageILO · 2024 · world median 657.95244.78657.95Moved since 2014
Nigeria: 244.78 · world median 657.95 · Statutory minimum wage per month (2021 PPP $). International Labour Organization (ILO), 2024 edition, data for 2024.
Published values in that edition run from 4.038 to 3,804.
Industry Value Added including Construction (% of GDP)World Bank Group · 2025 · world median 24.6516.4424.65Moved since 2015
Nigeria: 16.44 · world median 24.65 · Industry, including construction, value added (% of GDP). World Bank Group, 2025 edition, data for 2025.
Published values in that edition run from 2.228 to 75.09.
Position 134th of 158 · derived, counted from the highest value.
Foreign Value Added Share of Gross ExportsOECD · 2022 · world median 27.419.26927.41Moved since 2012
Nigeria: 9.269 · world median 27.41 · Foreign value added (% of gross exports). OECD, 2022 edition, data for 2022.
Published values in that edition run from 4.491 to 66.08.
Services ExportsUNCTAD · 2025 · world median 9.6021.7389.602Moved since 2015
Nigeria: 1.738 · world median 9.602 · Services exports (% of GDP). UN Trade and Development (UNCTAD), 2025 edition, data for 2025.
Published values in that edition run from 0.085 to 166.21.
Complexity Outlook IndexGrowth Lab at Harvard University · 2024 · world median -0.225-1.226-0.225Moved since 2014
Nigeria: -1.226 · world median -0.225 · Complexity Outlook Index (standardised; roughly −2.5 to +3). Growth Lab at Harvard University, 2024 edition, data for 2024.
Published values in that edition run from -1.682 to 2.878.
Creative Goods ExportsUNCTAD · 2024 · world median 1.23501.235Moved since 2014
Nigeria: 0 · world median 1.235 · Creative goods exports (% of merchandise exports). UN Trade and Development (UNCTAD), 2024 edition, data for 2024.
Published values in that edition run from 0 to 37.23.
No current reading for Nigeria
Business Ready: Operational Efficiency, Business Ready: Public Services, Business Ready: Regulatory Framework, Container Port Traffic (last 2023), Creative Services Exports, Exports of Goods and Services (% of GDP), General Government Consumption, Gini Index (last 2022), Gini Index of Disposable Income (SWIID) (last 2022), GNI per Capita (PPP) (last 2021), Gross Capital Formation (% of GDP), Gross Savings (% of GDP), Household Consumption, Imports of Goods and Services (% of GDP), Income Share Held by Lowest 20% (last 2022), Income Share Held by Richest 10% (last 2022), New Business Density (last 2022), Palma Ratio (last 2022), Research and Development Spending (last 2019), Tax Revenue (% of GDP) (last 2023) and Trade (% of GDP). Listed rather than hidden, so the page can be checked against it.
“Position · derived” is this site’s ordering of the published values, 1st = best unless the row says otherwise; the publisher ranks no country on it. Rank, position and standing
05Country Index 2026
Economy & Innovation among Nigeria’s 16 topics
Economy & Innovation is Nigeria’s 9th best-placed topic of 16. Strongest first, each marker at its share of that topic’s field.
- Work & Labour16th of 1824/4 keys
- Environment & Sustainabilityjoint 73rd of 1864/4 keys
- Digital & Technology82nd of 1984/4 keys
- Democracy & Civil Liberties128th of 1984/4 keys
- Peace & Security120th of 1774/4 keys
- Energy117th of 1653/3 keys
- Gender & Equality138th of 1834/4 keys
- Governance & Institutions149th of 1944/4 keys
- Economy & Innovation136th of 1764/4 keys
- Food & Agriculture143rd of 1844/4 keys
- Poverty & Inequalityjoint 128th of 1593/3 keys
- Mobility & Trade144th of 1774/4 keys
- Education & Knowledgejoint 174th of 1984/4 keys
- Development & Human Capital179th of 1963/3 keys
- Risk & Resilience181st of 1934/4 keys
- Health & Wellbeing196th of 2004/4 keys
06The top of the list
Who leads on economy & innovation
The three countries placed highest of 176, and the leaders Nigeria can most readily be measured against.
 1
 Austria
Western Europe
1st of 176 · 4 of 4 keys
Photo: chensiyuan · CC BY-SA 4.0, greyscale
 2
 Japan
Eastern Asia
2nd of 176 · 4 of 4 keys
Photo: JurriaanH · CC BY-SA 3.0, greyscale
 3
 Germany
Western Europe
3rd of 176 · 4 of 4 keys
Placed highest nearby
Highest in Africa
 Mauritius36th4/4 keys
Highest in Western Africa
 Togo114th4/4 keys
This page
Nigeria136th4/4 keys
Positions out of 176 placed on the topic. A country needs readings on enough keys to be placed, and the top of the list is often held on fewer of them.
07Analysis
Charts and analysis about Nigeria and economy & innovation
On economy & innovation
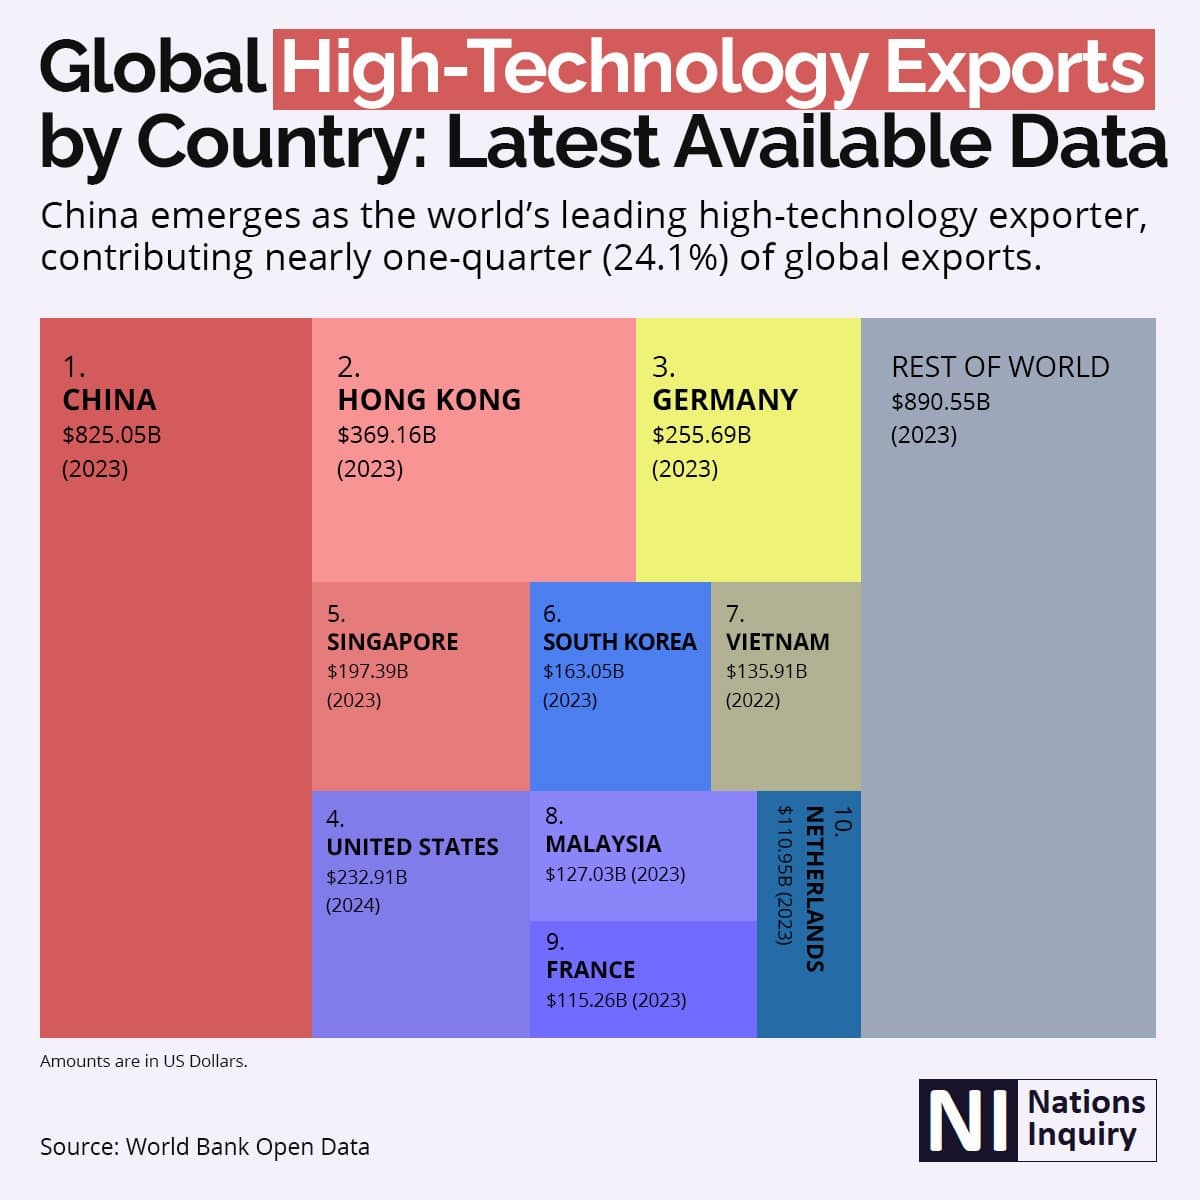
China Leads Global High-Technology Exports
The world’s ten largest high-technology exporters as a treemap, with the rest of the world beside them. Each country’s figure is its own most recent year, between 2022 and 2024.
On economy & innovation
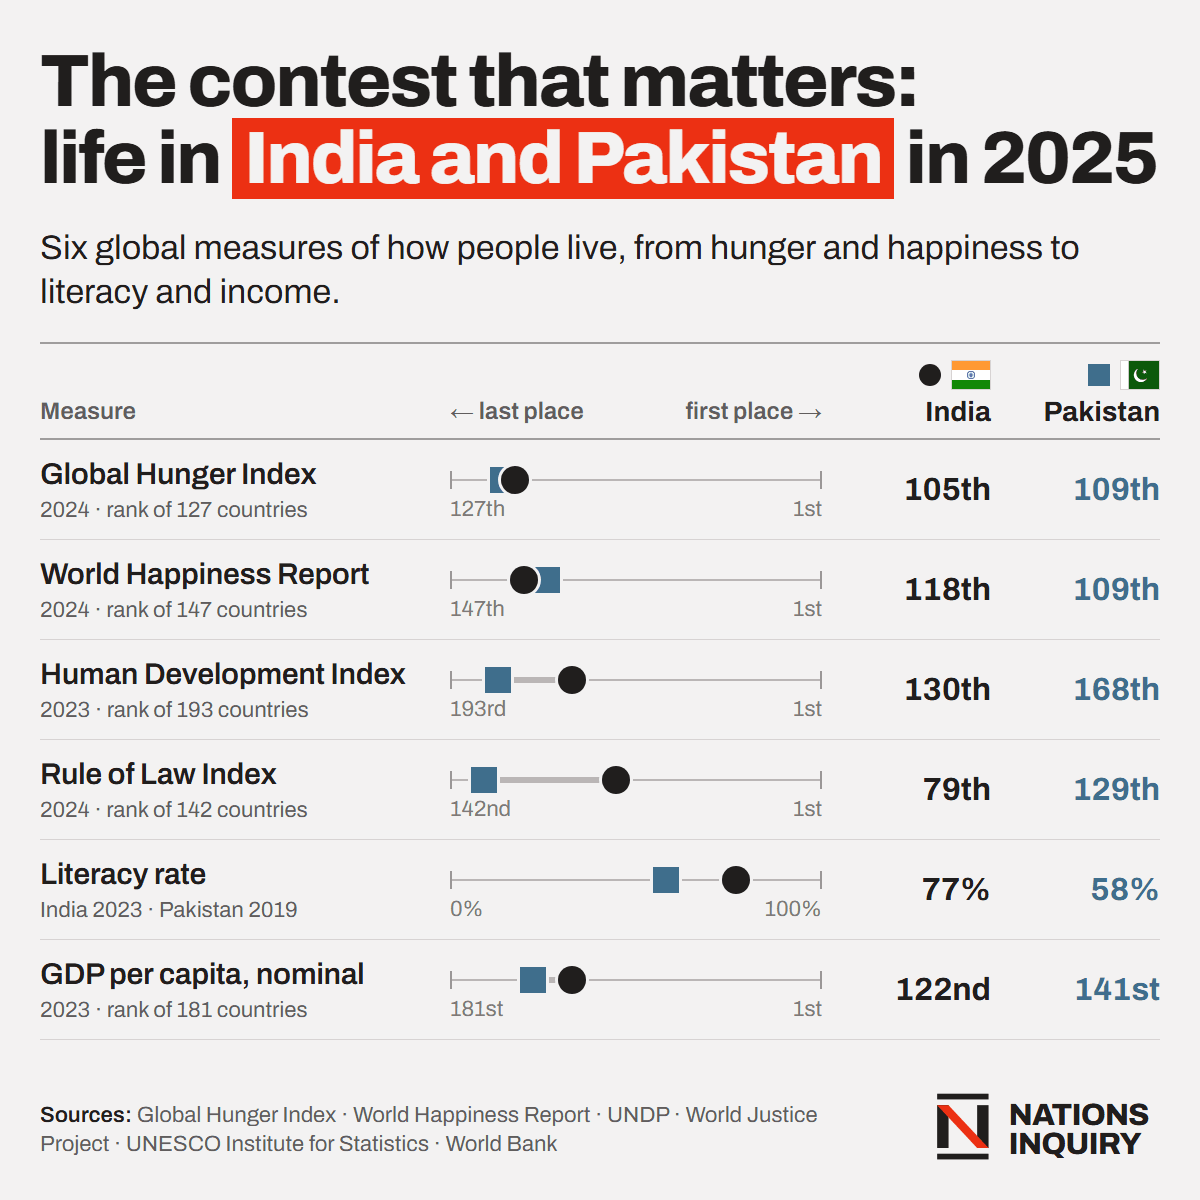
India vs Pakistan 2025: Comparison of Hunger Index, Happiness, HDI, Rule of Law, Literacy & GDP
India and Pakistan on six published measures: hunger, happiness, human development, rule of law, literacy and GDP per capita, each from its own publisher and year.
On economy & innovation
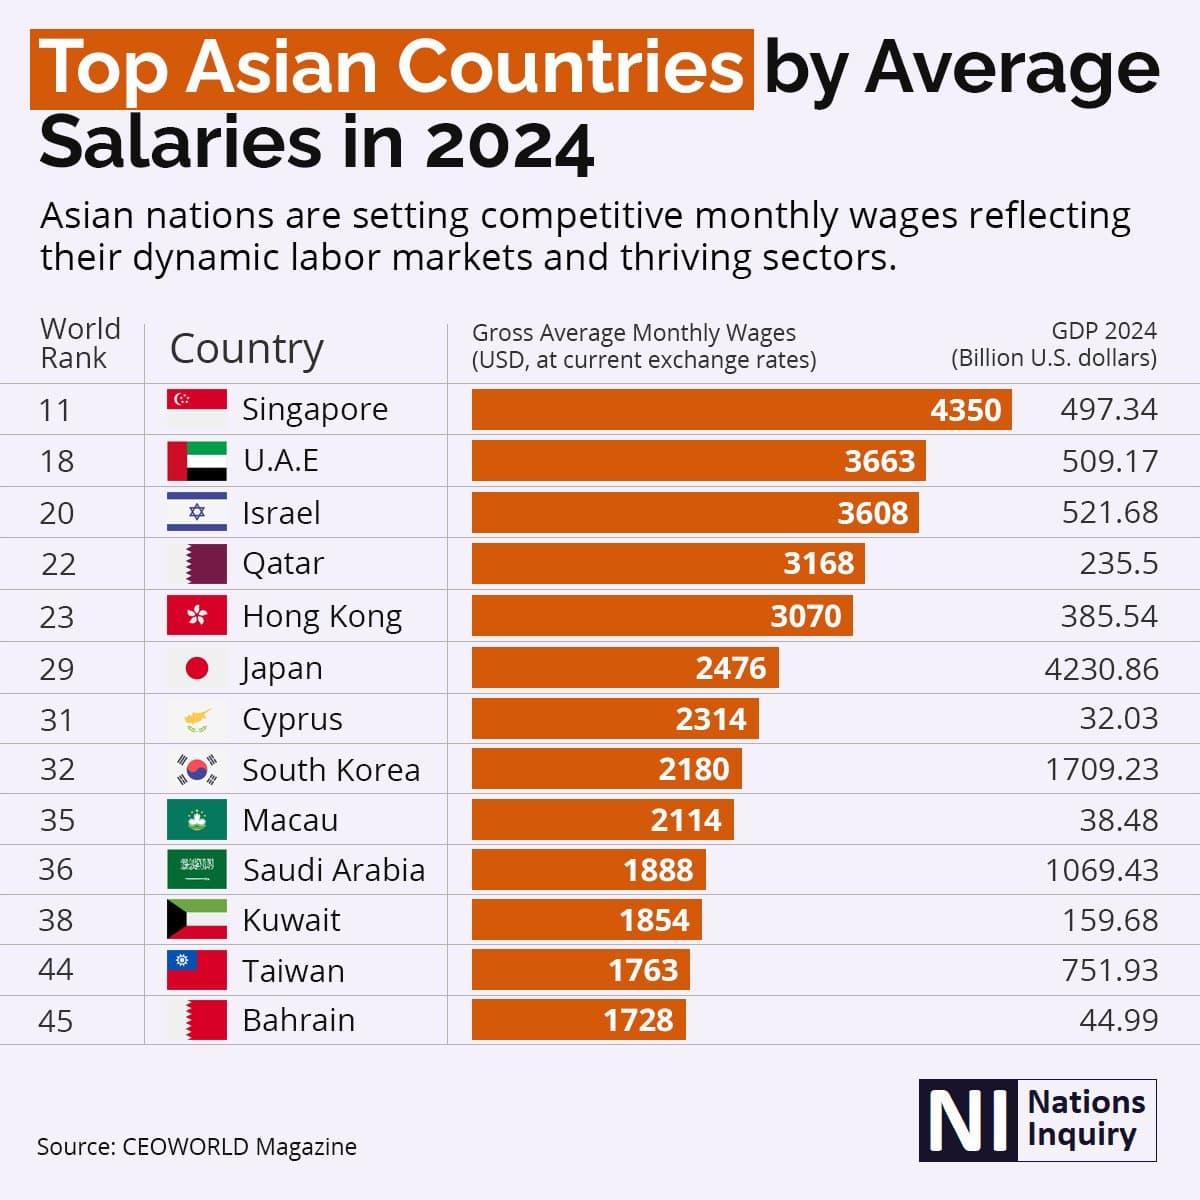
Countries in Asia with the highest average salaries 2024
Thirteen Asian countries by gross average monthly wage, each carrying its WORLD rank rather than an Asian one — so the numbers skip, from 11th place to 45th.
08Questions
Nigeria on economy & innovation: questions answered
Every answer is built from the numbers on this page, so none can say something the page does not.
How does Nigeria rank on economy & innovation?
Nigeria is placed 136th of 176 countries on Economy & Innovation in the Country Index 2026, from 4 of its 4 key statistics (GDP per Capita (PPP), Firms with a Bank Loan or Line of Credit, Economic Complexity Index and Account Ownership at a Financial Institution). The position is this site’s ordering of published statistics, not a rank any publisher printed.
What is the latest GDP per Capita (PPP) figure for Nigeria?
8,145 in 2025 (gDP per capita (constant 2021 international $, PPP)), according to World Bank Group. The world median in the same edition was 17,265.
What is the latest Firms with a Bank Loan or Line of Credit figure for Nigeria?
20.82 in 2025 (firms with a bank loan or line of credit (%)), according to World Bank Group. The world median in the same edition was 35.95.
How does Nigeria compare with Cameroon on economy & innovation?
Cameroon is placed 116th of 176, and Nigeria 136th. GDP per Capita (PPP): Cameroon 4,946, Nigeria 8,145; Firms with a Bank Loan or Line of Credit: Cameroon 52.24, Nigeria 20.82; Economic Complexity Index: Cameroon -1.594, Nigeria -2.281; Account Ownership at a Financial Institution: Cameroon 60.87, Nigeria 63.26.
How have Nigeria’s economy & innovation figures changed?
GDP per Capita (PPP) rose from 4,889 in 2000 to 8,145 in 2025; Economic Complexity Index rose from -2.464 in 2000 to -2.281 in 2024; Account Ownership at a Financial Institution rose from 29.67 in 2011 to 63.26 in 2024.
Which economy & innovation statistics are missing for Nigeria?
No current reading is published for Nigeria on Business Ready: Operational Efficiency, Business Ready: Public Services, Business Ready: Regulatory Framework, Container Port Traffic, Creative Services Exports, Exports of Goods and Services (% of GDP), General Government Consumption, Gini Index, Gini Index of Disposable Income (SWIID), GNI per Capita (PPP), Gross Capital Formation (% of GDP), Gross Savings (% of GDP), Household Consumption, Imports of Goods and Services (% of GDP), Income Share Held by Lowest 20%, Income Share Held by Richest 10%, New Business Density, Palma Ratio, Research and Development Spending, Tax Revenue (% of GDP) and Trade (% of GDP). They are listed rather than hidden, so the evidence on the page can be checked against it.
09Method
Method, sources and how to cite
What this topic does not measure
The total size of an economy is deliberately left out: a very large economy spread over a very large population is not doing more for each person. Growth rates, trade shares and the structure of output (how much is farming, industry or services) are published here as context, because they describe an economy's shape rather than how well it serves people. Jobs and wages have their own topic, Work & Labour.
How the Economy & Innovation standing is decided
A standing is this site’s ordering, named with its edition — never a publisher’s rank. 4 key statistics vote, one vote each; every country’s published value becomes a place within that key’s own field, the places are averaged, and the average is never published. A country needs 2 of the 4 keys to be placed.
The economy & innovation method, step by stepHow every standing on this site is built
The key statistics and their licences
- GDP per Capita (PPP) — World Bank Group, CC BY 4.0
- Firms with a Bank Loan or Line of Credit — World Bank Group, CC BY 4.0
- Economic Complexity Index — Growth Lab at Harvard University, CC0 1.0
- Account Ownership at a Financial Institution — World Bank Group, CC BY 4.0
The other 49 statistics on this page come from 14 publishers, each named beside its numbers, with every edition and licence on the datasets pages.
The standing itself is part of the Country Index 2026, published under CC BY-SA 4.0.
Photographs
Nigeria’s banner and the countries placed highest, from their profiles: Wikimedia Commons, shown in greyscale, each used under the licence named.
- Nigeria (banner) — Slashme, CC BY-SA 3.0
- Austria — chensiyuan, CC BY-SA 4.0
- Japan — JurriaanH, CC BY-SA 3.0
- Germany — dronepicr, CC BY 2.0
Cite this page
Nations Inquiry (2026). Nigeria: Economy & Innovation — standing and statistics, Country Index 2026. https://nationsinquiry.com/countries/nigeria/economy