Loading…
IDMC · Internal Displacements by Disaster
Disaster displacement by country
How many people were forced from their homes by disasters?
Of the 160 countries compared in 2024, Serbia had the lowest reading, 1, and United States had the highest reading, 11,001,000. In the middle country the figure was 4,750. Among the 26 countries measured in every edition since 2008, the middle one moved from 76,000 to 242,000.
Disaster displacement · 2024
Context statistic

Lowest of 160Serbia
1012024 · position · derived
Who leads
The three countries at the lowest end of 160 compared, the three at the other end, and the first on each continent.
 1
1Photo: Lošmi derivative work: Jjtkk · CC BY-SA 3.0, greyscale
 2
2Photo: Pudelek (Marcin Szala) derivative work: Jjtkk · CC BY-SA 3.0, greyscale
 3
3Photo: (Jan Mehlich) · CC BY-SA 3.0, greyscale

Highest in 2024
 United States11,001,000
 Philippines8,996,000
 India5,431,000
Where a country sits says how it compares with the others measured, and nothing about why.
Lowest on each continent
02Every measured country
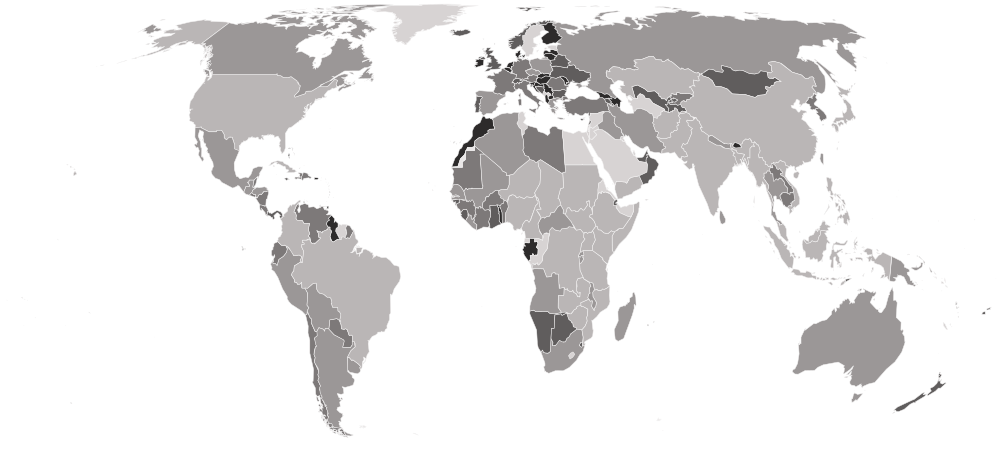
Disaster displacement on a map
Each country is shaded by its value, in five groups holding the same number of countries. Hover a country for its value, or select it to open its profile. Below the map, each continent’s middle country.
Darker is a lower value — the better end.
- 91,000–11,001,000
- 14,000–85,000
- 2,300–13,000
- 360–2,100
- 1–340
- No reading in 2024 (41 measured in an earlier edition)
- Europe
440
the middle country, of 35 measured · 49 members
Serbia1 Greece60,000
Lowest and highest reading in Europe.
- Oceania
1,230
the middle country, of 8 measured · 21 members
 French Polynesia21
 Australia32,000
Lowest and highest reading in Oceania.
- Americas
4,800
the middle country, of 33 measured · 48 members
 Saint Lucia27United States11,001,000
Lowest and highest reading in Americas.
- Asia
13,000
the middle country, of 39 measured · 52 members
 Azerbaijan100Philippines8,996,000
Lowest and highest reading in Asia.
- Africa
30,000
the middle country, of 45 measured · 55 members
 Togo9
Togo9 Chad1,325,000
Lowest and highest reading in Africa.
- Every region
22 sub-regions, lowest middle country first
- Northern Europe
10
the middle country, of 8 measured · 13 members
 Lithuania4
 United Kingdom1,500
Lowest and highest reading in Northern Europe.
- Southern Europe
20
the middle country, of 11 measured · 17 members
Serbia1Greece60,000Lowest and highest reading in Southern Europe.
- Eastern Europe
775
the middle country, of 10 measured · 10 members
 Hungary8
 Poland44,000
Lowest and highest reading in Eastern Europe.
- Caribbean
1,100
the middle country, of 12 measured · 24 members
Saint Lucia27 Cuba480,000
Lowest and highest reading in Caribbean.
- Western Asia
1,850
the middle country, of 10 measured · 19 members
Azerbaijan100 Yemen492,000
Lowest and highest reading in Western Asia.
- Western Europe
2,550
the middle country, of 6 measured · 9 members
 Belgium49
 Germany7,000
Lowest and highest reading in Western Europe.
- Western Africa
5,200
the middle country, of 15 measured · 16 members
Togo9 Nigeria1,245,000
Lowest and highest reading in Western Africa.
- Central America
5,750
the middle country, of 8 measured · 8 members
 Panama2,100
 Guatemala81,000
Lowest and highest reading in Central America.
- Eastern Asia
13,000
the middle country, of 7 measured · 8 members
 Hong Kong390
 China3,926,000
Lowest and highest reading in Eastern Asia.
- South America
14,000
the middle country, of 11 measured · 12 members
 Guyana32
 Brazil1,124,000
Lowest and highest reading in South America.
- Southern Asia
84,000
the middle country, of 9 measured · 9 members
 Bhutan160India5,431,000
Lowest and highest reading in Southern Asia.
- Eastern Africa
91,500
the middle country, of 16 measured · 19 members
 Djibouti430
 Mozambique585,000
Lowest and highest reading in Eastern Africa.
- Middle Africa
173,000
the middle country, of 6 measured · 9 members
 Gabon18Chad1,325,000
Lowest and highest reading in Middle Africa.
- South-eastern Asia
236,000
the middle country, of 9 measured · 11 members
 Timor-Leste2,100Philippines8,996,000
Lowest and highest reading in South-eastern Asia.
- Australia and New Zealand
2 of 2 measured — too few for a middle: Australia, New Zealand.
 New Zealand1,700Australia32,000
Lowest and highest reading in Australia and New Zealand.
- Central Asia
4 of 5 measured — too few for a middle: Kazakhstan, Kyrgyzstan, Tajikistan, Uzbekistan.
 Uzbekistan360
 Kazakhstan120,000
Lowest and highest reading in Central Asia.
- Melanesia
3 of 5 measured — too few for a middle: Fiji, Papua New Guinea, Vanuatu.
 Fiji760
 Papua New Guinea31,000
Lowest and highest reading in Melanesia.
- Micronesia
1 of 7 measured — too few for a middle: Marshall Islands.
 Marshall Islands320
Lowest and highest reading in Micronesia.
- Northern Africa
4 of 6 measured — too few for a middle: Algeria, Libya, Morocco, Sudan.
 Morocco270
 Sudan200,000
Lowest and highest reading in Northern Africa.
- Northern America
2 of 4 measured — too few for a middle: Canada, United States.
 Canada45,000United States11,001,000
Lowest and highest reading in Northern America.
- Polynesia
2 of 7 measured — too few for a middle: French Polynesia, Tonga.
French Polynesia21 Tonga40
Lowest and highest reading in Polynesia.
- Southern Africa
4 of 5 measured — too few for a middle: Botswana, Eswatini, Namibia, South Africa.
 Eswatini420
 South Africa36,000
Lowest and highest reading in Southern Africa.
03The whole field at once
The spread
160 countries, one dot each, on one scale — further right is a higher value. Half the countries are above 4,750; a quarter are above 57,250, and a quarter below 505. The bar in each row marks that continent’s middle country.
Log scale: each gridline is ten times the one before, so countries of very different sizes can be seen on one line.
04All 201 ever measured
Every country
In order, highest value first — position 1 is the highest value, the way IDMC’s own tables read. “=” marks a position shared with another country. Internal Displacement Monitoring Centre (IDMC) ranks nobody on this measure; the position is derived here by ordering the published values. A count, not a rate: these are people, so large countries dominate and China and India move millions in a bad year. A blank is not a zero — it means no figure was reported, which for this measure is usually the good outcome.
Showing 25 of 201 countries





























































































































































Values for 2024. The change column compares 2024 with 2023 only; the sparkline covers the recent editions.
052008–2024 · 17 editions
Over time
Each point is one annual edition from 2008. IDMC’s conflict displacement figures are stored beside the headline as columns, because they reach far fewer countries.
- the middle country
- the middle half of countries
- the middle of the 26 countries measured every time
- each continent’s middle country
The same, year by year
| Year | Countries | Middle country | Middle half | Measured every time |
|---|---|---|---|---|
| 2024 | 160 | 4,750 | 505 – 57,250 | 242,000 |
| 2023 | 146 | 6,250 | 645 – 68,750 | 192,000 |
| 2022 | 145 | 4,100 | 320 – 45,000 | 234,000 |
| 2021 | 134 | 5,650 | 520 – 32,750 | 84,500 |
| 2020 | 143 | 7,200 | 605 – 50,500 | 189,500 |
| 2019 | 137 | 5,600 | 430 – 52,000 | 94,500 |
| 2018 | 142 | 5,100 | 400 – 27,000 | 77,500 |
| 2017 | 133 | 6,000 | 570 – 31,000 | 103,000 |
| 2016 | 117 | 7,000 | 660 – 36,000 | 50,000 |
| 2015 | 113 | 5,400 | 1,000 – 36,000 | 68,500 |
| 2014 | 100 | 6,150 | 1,150 – 34,250 | 37,000 |
| 2013 | 119 | 5,500 | 1,000 – 30,500 | 169,000 |
| 2012 | 80 | 16,500 | 3,350 – 77,250 | 79,000 |
| 2011 | 62 | 19,500 | 6,325 – 60,000 | 28,500 |
| 2010 | 73 | 25,000 | 5,000 – 130,000 | 217,500 |
| 2009 | 61 | 20,000 | 5,300 – 80,000 | 57,000 |
| 2008 | 80 | 10,500 | 1,000 – 64,750 | 76,000 |
062023 → 2024
Who rose and fell
The biggest changes in value between the two newest editions. Places are shown second, because they also move when other countries do.
Improved most
before → afterWorsened most
before → after- United States201,000 → 11,001,000 · 21st → 1st+10,800,000
- Philippines2,595,000 → 8,996,000 · 3rd → 2nd+6,401,000
- India528,000 → 5,431,000 · 14th → 3rd+4,903,000
- Chad16,000 → 1,325,000 · 60th → 6th+1,309,000
- Nigeria166,000 → 1,245,000 · 26th → 7th+1,079,000
128 countries were measured in both 2023 and 2024. The field changed from 146 to 160 countries, so a place can move for reasons that have nothing to do with the country itself.
07Across every edition
Disaster displacement in records
The extremes of the statistic. A record reached by more than one country names none of them.
Highest reading on record
18,660,000
New displacements by disaster (people)
Lowest reading on record
Reached 4 times by 3 countries — shared, so no holder is named
1
New displacements by disaster (people)
Biggest improvement between editions
−14,629,000
18,660,000 → 4,031,000
Biggest decline between editions
+11,889,000
4,031,000 → 15,920,000
Most improved since first measured
−14,734,000
18,660,000 → 3,926,000
At the top most often
2 of 17
editions, alone at the first-listed end
08The measure
About disaster displacement
This counts how many people were forced from their homes inside their own country by floods, storms, earthquakes and wildfires in a year. The Internal Displacement Monitoring Centre compiles it, and it is the only measure here of people moved by climate and geology rather than by war.
What the number is: New displacements by disaster (people).
09Where it fits
Connections
Its part in the Country Index, the statistics whose values line up most closely with it across countries, and others on the same subject.
In the Country Index
Context, with no vote
This statistic is published in full under Environment & Sustainability and Risk & Resilience, but does not help decide any Country Index standing.
Environment & SustainabilityRisk & ResilienceWhich statistics vote, and why
Moves with
Where disaster displacement is higher, these tend to be higher too.
- Total PopulationUN DESA Population Division · 160 countries in commonρ 0.74
- Land AreaFAO · 159 countries in commonρ 0.64
- Agricultural EmissionsFAO · 157 countries in commonρ 0.61
Moves against
Where disaster displacement is higher, these tend to be lower.
- Public Sector EmploymentWorld Bank Group · 106 countries in commonρ −0.61
- Trade (% of GDP)World Bank Group · 114 countries in commonρ −0.57
- Exports of Goods and Services (% of GDP)World Bank Group · 114 countries in commonρ −0.56
Rank correlation (ρ, from −1 to 1) across countries, on each statistic’s newest edition, out of 120 statistics sharing at least 80 countries with this one. Two statistics that move together do not cause each other.
10Keep reading
Explore further
The countries at either end
11Questions
Disaster displacement: questions and answers
Which country has the lowest disaster displacement?
Serbia, at 1, among the 160 countries compared in 2024.
Which country has the highest disaster displacement?
United States, at 11,001,000, among the 160 countries compared in 2024.
How many countries does the Internal Displacements by Disaster cover?
160 in 2024, and 201 at least once across all editions. The number measured varies from 61 to 160 between editions.
What is the world average disaster displacement?
This site does not calculate a world average, which would depend on how countries are weighted. In the middle country of the 160 compared in 2024, the figure was 4,750.
Is this Internal Displacement Monitoring Centre (IDMC)’s own ranking?
No. Internal Displacement Monitoring Centre (IDMC) publishes the values but ranks nobody; the position on this page is derived by Nations Inquiry by ordering the published values, and equal values share a position.
How often is the Internal Displacements by Disaster published?
This site holds 17 editions, describing 2008 to 2024.
Where does the data come from, and can I download it?
From Internal Displacement Monitoring Centre (IDMC), under CC BY 4.0. From IDMC’s Global Internal Displacement Database via the Humanitarian Data Exchange. Turning the counts into rates would need population weights the file does not carry. Every edition is available on this site’s Datasets pages as a full table, unrounded.
12Method
Sources, method and citation
Source
Internal Displacements by Disaster — Internal Displacement Monitoring Centre (IDMC)
From IDMC’s Global Internal Displacement Database via the Humanitarian Data Exchange. Turning the counts into rates would need population weights the file does not carry.
Newest edition
Report year 2024Data year 2024
Cite the source as: Internal Displacement Monitoring Centre. Global Internal Displacement Database. Geneva: IDMC.
Licence: CC BY 4.0, checked 2026-09-07.
How this page reads the numbers
- Internal Displacement Monitoring Centre (IDMC) ranks nobody on this measure. The position is derived by Nations Inquiry by ordering the published values; equal values share a position.
- Which end is better follows the publisher’s own reading of the measure.
- A country is named at an end only when it holds that value alone. Where several share it, the page says how many and names none first.
- Values are stored exactly as published and trimmed only for display. “The middle country” is the median of the countries measured, not a world average.
The full note on this data
17 editions (2008–2024), covering 61 to 160 countries, from IDMC’s Global Internal Displacement Database via the Humanitarian Data Exchange. How many people were forced from their homes inside their own country by floods, storms, earthquakes and wildfires in the year. ⚠ WHY DISASTERS AND NOT CONFLICT: the workbook carries four figures, and only this one is a world table. Conflict displacements reach 20–49 countries a year and the year-end stocks fewer still, so all three are stored as columns beside the headline rather than leading. It is also the half of IDMC’s work the site does not otherwise cover — conflict displacement sits beside `organized-violence` and `inform-severity`, while this is the only measure here of people moved by climate and geology. ⚠ A COUNT, NOT A RATE. These are people, so large countries dominate: China and India move millions in a bad year. Turning them into rates would need population weights the file does not carry, the same call already made for UCDP’s death counts. ⚠ A BLANK IS NOT A ZERO — it means the figure was not reported. A country absent from an edition had no reported disaster displacement, which is the good outcome and not a gap in the data. ⚠ IT IS NOT FILED UNDER MOBILITY, though it is certainly about people moving. That topic is about crossing borders freely — passports, ports, customs — and ranking countries on this alongside those would read as “Bangladesh is poorly connected” when what it means is “Bangladesh floods”. ⚠ ⚠ No rank is published. A POSITION is derived here (2026-09-10) by ordering the count, highest first. ⚠ IT COUNTS PEOPLE, so the order tracks how many were displaced and therefore partly how many people live there — a large country high in this table is not being governed worse than a small one below it. ⚠ IDMC rounds its larger figures, so exact ties appear at round numbers: four countries sit at exactly 1,000 in 2024 and share position 110.
Photographs
The countries at the top of this statistic, from their profiles: Wikimedia Commons, shown in greyscale, each used under the licence named.
- Serbia — Lošmi derivative work: Jjtkk, CC BY-SA 3.0
- North Macedonia — Pudelek (Marcin Szala) derivative work: Jjtkk, CC BY-SA 3.0
- Lithuania — (Jan Mehlich), CC BY-SA 3.0
Cite this page
Nations Inquiry (2026). Disaster displacement by country: Internal Displacements by Disaster, data from Internal Displacement Monitoring Centre (IDMC). https://nationsinquiry.com/statistics/disaster-displacement