
Photo: Hans Hillewaert derivative work: Jjtkk · CC BY-SA 3.0 · via Wikimedia Commons, shown in greyscale
Topic 01 of 18 · Country Index 2026

Namibia: Governance & Institutions
How well is the state actually run?
Namibia is placed joint 84th of 194 countries on governance & institutions in the Country Index 2026, from 4 of its 4 key statistics. Readings behind it: Government Effectiveness 0.101 (2025); Statistical Performance Indicators 55.66 (2024).
Share
Governance & Institutions
joint84th
of 194 countries placed
Placed from 4 of 4 key statistics
- 0.101Government Effectiveness, 2025Governance estimate (−2.5 weak to 2.5 strong)
- 55.66Statistical Performance Indicators, 2024SPI overall score (0–100)
- 46Corruption Perceptions Index, 2025CPI score (0–100, where 100 is very clean)
- 0.811Judicial Constraints on the Executive Index, 2025Judicial constraints on the executive index (0–1)
01The evidence
The 4 key statistics that decide it
Only these place Namibia on governance & institutions — one vote each. Every value is the publisher’s own, read at the edition the Country Index 2026 used; the grey ticks are every other country it was compared with, lowest on the left.
0.101
Governance estimate (−2.5 weak to 2.5 strong)
Higher is better
Namibia: 0.101. Across the 209 countries in this edition, values run from -2.251 (South Sudan) to 2.092 (Singapore); the world median is 0.101.
- World median
- 0.101
- Best in Southern Africa
- 0.434 Botswana
- Land neighbours
- Angola -0.709 · Botswana 0.434 · South Africa -0.023 · Zambia -0.39
Key 2 of 4
Statistical Performance Indicators
World Bank Group
2024 edition · data for 2024 · CC BY 4.0
55.66
SPI overall score (0–100)
Higher is better
Namibia: 55.66. Across the 188 countries in this edition, values run from 27.12 (South Sudan) to 94.14 (Norway); the world median is 69.3.
- World median
- 69.3
- Best in Southern Africa
- 81.29 South Africa
- Land neighbours
- Angola 58.15 · Botswana 64.21 · South Africa 81.29 · Zambia 64.17
Key 3 of 4
Corruption Perceptions Index
Transparency International
2025 edition · data for 2025 · CC BY 4.0 (the data), CC BY-ND 4.0 (the website and report)
46
CPI score (0–100, where 100 is very clean)
Higher is better
Ranked 65th of 181 by Transparency International
Namibia: 46. Across the 182 countries in this edition, values run from 9 (Somalia) to 89 (Denmark); the world median is 39.
- World median
- 39
- Best in Southern Africa
- 58 Botswana
- Land neighbours
- Angola 32 · Botswana 58 · South Africa 41 · Zambia 37
Key 4 of 4
Judicial Constraints on the Executive Index
V-Dem Institute, University of Gothenburg
2025 edition · data for 2025 · CC BY-SA 4.0
0.811
Judicial constraints on the executive index (0–1)
Higher is better
Namibia: 0.811. Across the 176 countries in this edition, values run from 0.003 (Nicaragua) to 0.988 (Australia); the world median is 0.676.
- World median
- 0.676
- Best in Southern Africa
- 0.895 South Africa
- Land neighbours
- Angola 0.234 · Botswana 0.748 · South Africa 0.895 · Zambia 0.71
02Over time
Which way Namibia is moving
Each key’s published value, edition by edition, beside the world median. The Country Index 2026 is the first edition of the standing, so the standing itself has no history to chart yet.
Government Effectiveness
Governance estimate (−2.5 weak to 2.5 strong) · higher is better
NamibiaWorld median
Namibia fell from 0.384 in 2000 to 0.101 in 2025; the world median went from -0.397 to 0.101.
Every year’s figures
Year Namibia World median 2025 0.1006 0.1006 2024 0.1763 0.0098 2023 0.1115 -0.0408 2022 0.1195 -0.0305 2021 0.1321 -0.0158 2020 0.1424 -0.0171 2019 0.2847 0.0150 2018 0.3154 0.0159 2017 0.2727 0.0158 2016 0.2394 0.0225 2015 0.3009 0.0038 2014 0.3128 0.0194 2013 0.3120 -0.0758 2012 0.3569 -0.0839 2011 0.1324 -0.1221 2010 0.2015 -0.1145 2009 0.4564 -0.1609 2008 0.3657 -0.2134 2007 0.2767 -0.3260 2006 0.2605 -0.3310 2005 -0.0129 -0.3706 2004 0.0198 -0.3140 2003 0.0536 -0.4369 2002 -0.0060 -0.3366 2000 0.3842 -0.3969 Statistical Performance Indicators
SPI overall score (0–100) · higher is better
NamibiaWorld median
Namibia rose from 49.87 in 2016 to 55.66 in 2024; the world median went from 56.25 to 69.3.
Every year’s figures
Year Namibia World median 2024 55.7 69.30 2023 55.0 68.86 2022 53.7 67.99 2021 54.6 69.96 2020 51.0 62.91 2019 50.2 61.19 2018 52.5 61.17 2017 52.9 59.55 2016 49.9 56.25 Corruption Perceptions Index
CPI score (0–100, where 100 is very clean) · higher is better
NamibiaWorld median
Namibia fell from 48 in 2012 to 46 in 2025; the world median went from 37 to 39.
Every year’s figures
Year Namibia World median 2025 46 39.0 2024 49 40.0 2023 49 40.0 2022 49 39.5 2021 49 39.0 2020 51 40.0 2019 52 39.5 2018 53 38.0 2017 51 38.5 2016 52 38.0 2015 53 37.0 2014 49 38.0 2013 48 38.0 2012 48 37.0 Judicial Constraints on the Executive Index
Judicial constraints on the executive index (0–1) · higher is better
NamibiaWorld median
Namibia fell from 0.896 in 2000 to 0.811 in 2025; the world median went from 0.647 to 0.676.
Every year’s figures
Year Namibia World median 2025 0.811 0.6760 2024 0.839 0.6645 2023 0.816 0.6590 2022 0.804 0.6600 2021 0.812 0.6580 2020 0.819 0.6645 2019 0.765 0.6560 2018 0.886 0.6485 2017 0.898 0.6550 2016 0.904 0.6520 2015 0.904 0.6700 2014 0.904 0.6515 2013 0.904 0.6550 2012 0.905 0.6750 2011 0.905 0.6680 2010 0.905 0.6640 2009 0.904 0.6580 2008 0.904 0.6590 2007 0.904 0.6630 2006 0.904 0.6590 2005 0.906 0.6580 2004 0.874 0.6480 2003 0.895 0.6480 2002 0.870 0.6470 2001 0.896 0.6530 2000 0.896 0.6465
03In context
Namibia beside its neighbours
A position reads best beside the countries around it. Every position below is a place among all 194 countries on governance & institutions, never a place within the region.
Namibia and the countries it borders
Standing among all 194; the key columns are the publishers’ own values.
| Country | Standing | Government EffectivenessGovernance estimate (−2.5 weak to 2.5 strong) | Statistical Performance IndicatorsSPI overall score (0–100) | Corruption Perceptions IndexCPI score (0–100, where 100 is very clean) | Judicial Constraints on the Executive IndexJudicial constraints on the executive index (0–1) |
|---|---|---|---|---|---|
 South Africa | =54th | -0.023 | 81.29 | 41 | 0.895 |
 Botswana | 65th | 0.434 | 64.21 | 58 | 0.748 |
| Namibia | =84th | 0.101 | 55.66 | 46 | 0.811 |
 Zambia | 113th | -0.39 | 64.17 | 37 | 0.71 |
 Angola | 154th | -0.709 | 58.15 | 32 | 0.234 |
“—”: no published reading in that edition. What a standing is
Across Southern Africa
Every country in the sub-region, by its place among all 194.


Placed either side on governance & institutions
The countries immediately above and below Namibia in the topic’s list.



04Context, no vote
Where Namibia is ahead of the world, and behind
37 more statistics filed under governance & institutions, published in full and deliberately given no vote in the standing. Select a row for the publisher, the rank and the links.
Ahead of the world median22
Statistics on which Namibia does better than the middle country measured.
Rigorous and Impartial Public AdministrationV-Dem Institute, University of Gothenburg · 2025 · world median 0.3332.7340.333▲ Improved since 2015
Namibia: 2.734 · world median 0.333 · Original latent estimate (≈ −3.6 to +4.0); higher = a more rigorous and impartial administration. V-Dem Institute, University of Gothenburg, 2025 edition, data for 2025.
Published values in that edition run from -3.552 to 3.99; higher is better.
Position 13th of 176 · derived.
Old-Age Pension CoverageILO · 2025 · world median 80.810080.8No earlier reading
Namibia: 100 · world median 80.8 · People above statutory pensionable age receiving an old-age pension (%). International Labour Organization (ILO), 2025 edition, data for 2025.
Published values in that edition run from 0 to 100; higher is better.
Civic Space RatingsCIVICUS · 2025 · world median 50.4680.1550.46No earlier reading
Namibia: 80.15 · world median 50.46 · Civic space score (0–100). CIVICUS, 2025 edition, data for 2025.
Published values in that edition run from 2.17 to 100; higher is better.
Position 41st of 198 · derived.
Labour Inspectors per 10,000 Employed PersonsILO · 2024 · world median 0.5751.080.575No earlier reading
Namibia: 1.08 · world median 0.575 · Labour inspectors per 10,000 employed persons. International Labour Organization (ILO), 2024 edition, data for 2024.
Published values in that edition run from 0.07 to 3.89; higher is better.
Political Corruption IndexV-Dem Institute, University of Gothenburg · 2025 · world median 0.5180.2740.518▼ Worsened since 2015
Namibia: 0.274 · world median 0.518 · Political corruption index (0–1; higher = more corrupt). V-Dem Institute, University of Gothenburg, 2025 edition, data for 2025.
Published values in that edition run from 0.004 to 0.968; lower is better.
Position 125th of 176 · derived, 1st = worst.
Neopatrimonial Rule IndexV-Dem Institute, University of Gothenburg · 2025 · world median 0.4450.2460.445▼ Worsened since 2015
Namibia: 0.246 · world median 0.445 · Neopatrimonial rule index (0–1; higher = more personalised rule). V-Dem Institute, University of Gothenburg, 2025 edition, data for 2025.
Published values in that edition run from 0.008 to 0.989; lower is better.
Position 121st of 176 · derived, 1st = worst.
Meritocratic Appointment in the State AdministrationV-Dem Institute, University of Gothenburg · 2025 · world median 0.3090.8470.309No real change since 2015
Namibia: 0.847 · world median 0.309 · Original latent estimate (≈ −2.9 to +3.6); higher = more appointments on merit. V-Dem Institute, University of Gothenburg, 2025 edition, data for 2025.
Published values in that edition run from -2.442 to 3.584; higher is better.
Position 59th of 176 · derived.
Liberal Democracy IndexV-Dem Institute, University of Gothenburg · 2025 · world median 0.3530.5190.353▼ Worsened since 2015
Namibia: 0.519 · world median 0.353 · Liberal democracy index (0–1). V-Dem Institute, University of Gothenburg, 2025 edition, data for 2025.
Published values in that edition run from 0.009 to 0.884; higher is better.
Position 60th of 176 · derived.
State Authority over TerritoryV-Dem Institute, University of Gothenburg · 2025 · world median 95.397.7595.3No real change since 2015
Namibia: 97.75 · world median 95.3 · Territory under effective state control (% of official territory). V-Dem Institute, University of Gothenburg, 2025 edition, data for 2025.
Published values in that edition run from 47.56 to 100; higher is better.
Disability Benefit CoverageILO · 2025 · world median 43.970.143.9No earlier reading
Namibia: 70.1 · world median 43.9 · People with severe disabilities receiving disability benefits (%). International Labour Organization (ILO), 2025 edition, data for 2025.
Published values in that edition run from 0 to 100; higher is better.
V-Dem Electoral Democracy IndexV-Dem Institute, University of Gothenburg · 2025 · world median 0.4970.6330.497▼ Worsened since 2015
Namibia: 0.633 · world median 0.497 · Electoral democracy index (0–1). V-Dem Institute, University of Gothenburg, 2025 edition, data for 2025.
Published values in that edition run from 0.016 to 0.913; higher is better.
Position 65th of 176 · derived.
Child and Family Benefit CoverageILO · 2024 · world median 23.7538.723.75No earlier reading
Namibia: 38.7 · world median 23.75 · Children or households with children receiving child or family cash benefits (%). International Labour Organization (ILO), 2024 edition, data for 2024.
Published values in that edition run from 0 to 100; higher is better.
Rule of LawWorld Bank Group · 2025 · world median -0.1020.376-0.102No real change since 2015
Namibia: 0.376 · world median -0.102 · Rule of Law estimate (−2.5 to 2.5). World Bank Group, 2025 edition, data for 2025.
Published values in that edition run from -2.199 to 2.012; higher is better.
Position 82nd of 211 · derived.
Voice and AccountabilityWorld Bank Group · 2025 · world median -0.0220.374-0.022▼ Worsened since 2015
Namibia: 0.374 · world median -0.022 · Voice and Accountability estimate (−2.5 to 2.5). World Bank Group, 2025 edition, data for 2025.
Published values in that edition run from -2.348 to 1.825; higher is better.
Position 81st of 206 · derived.
State Capacity IndexJonathan K. Hanson (University of Michigan) and Rachel Sigman (Naval Postgraduate School) · 2015 · world median 0.4870.6550.487No real change since 2005
Namibia: 0.655 · world median 0.487 · Latent estimate of state capacity (≈ −2.3 to +3.0, centred near 0); higher = a more capable state. Jonathan K. Hanson (University of Michigan) and Rachel Sigman (Naval Postgraduate School), 2015 edition, data for 2015.
Published values in that edition run from -2.096 to 2.697; higher is better.
Position 66th of 166 · derived.
Control of CorruptionWorld Bank Group · 2025 · world median -0.1970.148-0.197▼ Worsened since 2015
Namibia: 0.148 · world median -0.197 · Control of Corruption (−2.5 to 2.5). World Bank Group, 2025 edition, data for 2025.
Published values in that edition run from -2.096 to 2.259; higher is better.
Position 85th of 211 · derived.
Regulatory QualityWorld Bank Group · 2025 · world median -0.0930.072-0.093▼ Worsened since 2015
Namibia: 0.072 · world median -0.093 · Regulatory Quality (−2.5 to 2.5). World Bank Group, 2025 edition, data for 2025.
Published values in that edition run from -2.106 to 2.113; higher is better.
Position 88th of 209 · derived.
Foundational ID OwnershipWorld Bank Group (ID4D) · 2024 · world median 94.495.7994.4▲ Improved since 2017
Namibia: 95.79 · world median 94.4 · Adults who own a foundational ID (% of population aged 15+). World Bank Group (ID4D), 2024 edition, data for 2024.
Published values in that edition run from 42.62 to 100; higher is better.
Women, Business and the LawWorld Bank Group · 2025 · world median 81.2583.1381.25▼ Worsened since 2015
Namibia: 83.13 · world median 81.25 · WBL Index (0–100, where 100 is full legal parity). World Bank Group, 2026 edition, data for 2025.
Published values in that edition run from 3.125 to 100; higher is better.
Position 85th of 190 · derived.
Trade Union DensityILO · 2020 · world median 16.6818.316.68No earlier reading
Namibia: 18.3 · world median 16.68 · Employees who are trade union members (%). International Labour Organization (ILO), 2020 edition, data for 2020.
Published values in that edition run from 0.2 to 91.42; higher is better.
Position 63rd of 139 · derived.
Firms Expecting to Make Informal Payments to Public OfficialsWorld Bank Group · 2026 · world median 6.4035.9026.403No earlier reading
Namibia: 5.902 · world median 6.403 · Firms saying firms like theirs pay officials informally to get things done (%). World Bank Group, 2026 edition, data for 2026.
Published values in that edition run from 0 to 55.03; lower is better.
Position 96th of 178 · derived, 1st = worst.
State Fiscal Source of RevenueV-Dem Institute, University of Gothenburg · 2025 · world median 1.1791.2581.179▼ Worsened since 2015
Namibia: 1.258 · world median 1.179 · Original latent estimate (≈ −2.9 to +3.1); higher = broader taxation. V-Dem Institute, University of Gothenburg, 2025 edition, data for 2025.
Published values in that edition run from -1.716 to 3.135; higher is better.
Position 84th of 176 · derived.
Behind the world median9
Statistics on which Namibia does worse than the middle country measured.
Government AI Readiness IndexOxford Insights · 2025 · world median 40.1937.0840.19No real change since 2020
Namibia: 37.08 · world median 40.19 · AI readiness score (0–100). Oxford Insights, 2025 edition, data for 2025.
Published values in that edition run from 12.12 to 88.36; higher is better.
Ranked 110th of 195 by Oxford Insights.
Agriculture Orientation IndexFAO · 2024 · world median 0.3050.280.305No real change since 2014
Namibia: 0.28 · world median 0.305 · Agriculture orientation index (1.0 = spending matches sector size). Food and Agriculture Organization of the United Nations (FAO), 2024 edition, data for 2024.
Published values in that edition run from 0.03 to 5.38; higher is better.
Position 75th of 132 · derived.
Climate Readiness (ND-GAIN)Notre Dame Global Adaptation Initiative (ND-GAIN), University of Notre Dame · 2024 · world median 0.3870.3480.387▼ Worsened since 2014
Namibia: 0.348 · world median 0.387 · ND-GAIN Readiness (0–1, where 1 is the most ready). Notre Dame Global Adaptation Initiative (ND-GAIN), University of Notre Dame, 2024 edition, data for 2024.
Published values in that edition run from 0.137 to 0.749; higher is better.
Ranked 124th of 192 by Notre Dame Global Adaptation Initiative (ND-GAIN), University of Notre Dame.
Bribery IncidenceWorld Bank Group · 2026 · world median 7.26913.777.269No earlier reading
Namibia: 13.77 · world median 7.269 · Firms asked for a bribe at least once in six dealings with officials (%). World Bank Group, 2026 edition, data for 2026.
Published values in that edition run from 0 to 64.26; lower is better.
Position 60th of 175 · derived, 1st = worst.
Global Indicators of Regulatory Governance ScoreWorld Bank Group · 2018 · world median 2.251.252.25No earlier reading
Namibia: 1.25 · world median 2.25 · Regulatory governance score (0–5, where 5 is the most transparent rule-making). World Bank Group, 2018 edition, data for 2018.
Published values in that edition run from 0 to 5; higher is better.
GovTech Maturity IndexWorld Bank Group · 2025 · world median 0.630.3630.63▼ Worsened since 2022
Namibia: 0.363 · world median 0.63 · GTMI score (0–1). World Bank Group, 2025 edition, data for 2025.
Published values in that edition run from 0.01 to 0.997; higher is better.
Position 146th of 196 · derived.
Equal Protection IndexV-Dem Institute, University of Gothenburg · 2025 · world median 0.6510.4010.651▼ Worsened since 2015
Namibia: 0.401 · world median 0.651 · Equal protection index (0–1); higher = rights and freedoms protected more equally across social groups and classes. V-Dem Institute, University of Gothenburg, 2025 edition, data for 2025.
Published values in that edition run from 0.027 to 0.986; higher is better.
Position 136th of 176 · derived.
Completeness of Birth RegistrationUNICEF · 2025 · world median 98.478.198.4No earlier reading
Namibia: 78.1 · world median 98.4 · Children under 5 whose birth is registered (%). UNICEF, 2025 edition, data for 2025.
Published values in that edition run from 2.7 to 100; higher is better.
Open Data InventoryOpen Data Watch · 2024 · world median 594159▲ Improved since 2015
Namibia: 41 · world median 59 · ODIN overall score (0–100). Open Data Watch, 2024 edition, data for 2024.
Published values in that edition run from 19 to 90; higher is better.
Ranked 139th of 168 by Open Data Watch.
Level with the median, or no median to compare1
Social Protection CoverageILO · 2025 · world median 52.152.152.1No earlier reading
Namibia: 52.1 · world median 52.1 · Population covered by at least one social protection benefit (%). International Labour Organization (ILO), 2025 edition, data for 2025.
Published values in that edition run from 0 to 100; higher is better.
No better end5
These describe the shape of a country — more is not better or worse, only different — so they are never ahead or behind.
Public Sector Wage BillWorld Bank Group · 2022 · world median 7.97514.737.975Moved since 2012
Namibia: 14.73 · world median 7.975 · Public sector wage bill (% of GDP). World Bank Group, 2022 edition, data for 2022.
Published values in that edition run from 0.977 to 42.65.
Position 12th of 168 · derived, counted from the highest value.
General Government ConsumptionWorld Bank Group · 2025 · world median 16.2122.2816.21Moved since 2015
Namibia: 22.28 · world median 16.21 · General government final consumption expenditure (% of GDP). World Bank Group, 2025 edition, data for 2025.
Published values in that edition run from 5.445 to 38.94.
Position 22nd of 132 · derived, counted from the highest value.
Senior Management Time Spent on Government RegulationWorld Bank Group · 2026 · world median 6.7958.3186.795No earlier reading
Namibia: 8.318 · world median 6.795 · Senior management time spent dealing with government regulation (% of a typical week). World Bank Group, 2026 edition, data for 2026.
Published values in that edition run from 0.025 to 31.33.
Public Sector EmploymentWorld Bank Group · 2022 · world median 15.0120.2115.01No earlier reading
Namibia: 20.21 · world median 15.01 · Public sector employment (% of total employment). World Bank Group, 2022 edition, data for 2022.
Published values in that edition run from 1.672 to 47.1.
Position 50th of 135 · derived, counted from the highest value.
Central Bank Independence IndexAna Carolina Garriga, University of Essex · 2023 · world median 0.6080.6010.608Moved since 2013
Namibia: 0.601 · world median 0.608 · CBI index (0–1, where 1 is the most statutory independence). Ana Carolina Garriga, University of Essex, 2023 edition, data for 2023.
Published values in that edition run from 0.006 to 0.974.
No current reading for Namibia
Business Ready: Operational Efficiency, Business Ready: Public Services, Business Ready: Regulatory Framework, Country Policy and Institutional Assessment, Debt Service on External Debt, External Debt Stocks (% of GNI), Government Funding per Primary Student (last 2014) and Government Spending on Education (last 2022). Listed rather than hidden, so the page can be checked against it.
“Position · derived” is this site’s ordering of the published values, 1st = best unless the row says otherwise; the publisher ranks no country on it. Rank, position and standing
05Country Index 2026
Governance & Institutions among Namibia’s 16 topics
Governance & Institutions is Namibia’s 7th best-placed topic of 16. Strongest first, each marker at its share of that topic’s field.
- Energy39th of 1653/3 keys
- Peace & Security49th of 1774/4 keys
- Democracy & Civil Liberties66th of 1984/4 keys
- Gender & Equality66th of 1834/4 keys
- Environment & Sustainability72nd of 1863/4 keys
- Education & Knowledge80th of 1983/4 keys
- Governance & Institutionsjoint 84th of 1944/4 keys
- Economy & Innovation100th of 1764/4 keys
- Mobility & Trade104th of 1774/4 keys
- Digital & Technologyjoint 117th of 1984/4 keys
- Development & Human Capital129th of 1963/3 keys
- Risk & Resiliencejoint 155th of 1934/4 keys
- Work & Labour157th of 1824/4 keys
- Health & Wellbeing175th of 2003/4 keys
- Poverty & Inequality143rd of 1593/3 keys
- Food & Agriculture167th of 1844/4 keys
06The top of the list
Who leads on governance & institutions
The three countries placed highest of 194, and the leaders Namibia can most readily be measured against.
 1
 Denmark
Northern Europe
1st of 194 · 4 of 4 keys
Photo: User:Aconcagua · CC BY-SA 3.0, greyscale
 2
 New Zealand
Australia and New Zealand
2nd of 194 · 4 of 4 keys
Photo: Karora derivative work: Inkey · Public domain, greyscale
 3
 Sweden
Northern Europe
3rd of 194 · 4 of 4 keys
Photo: User:Pieter Kuiper · Public domain, greyscale
Placed highest nearby
Highest in Africa
 Seychelles38th4/4 keys
Highest in Southern Africa
South Africa=54th4/4 keysThis page
Namibia=84th4/4 keys
Positions out of 194 placed on the topic. A country needs readings on enough keys to be placed, and the top of the list is often held on fewer of them.
07Analysis
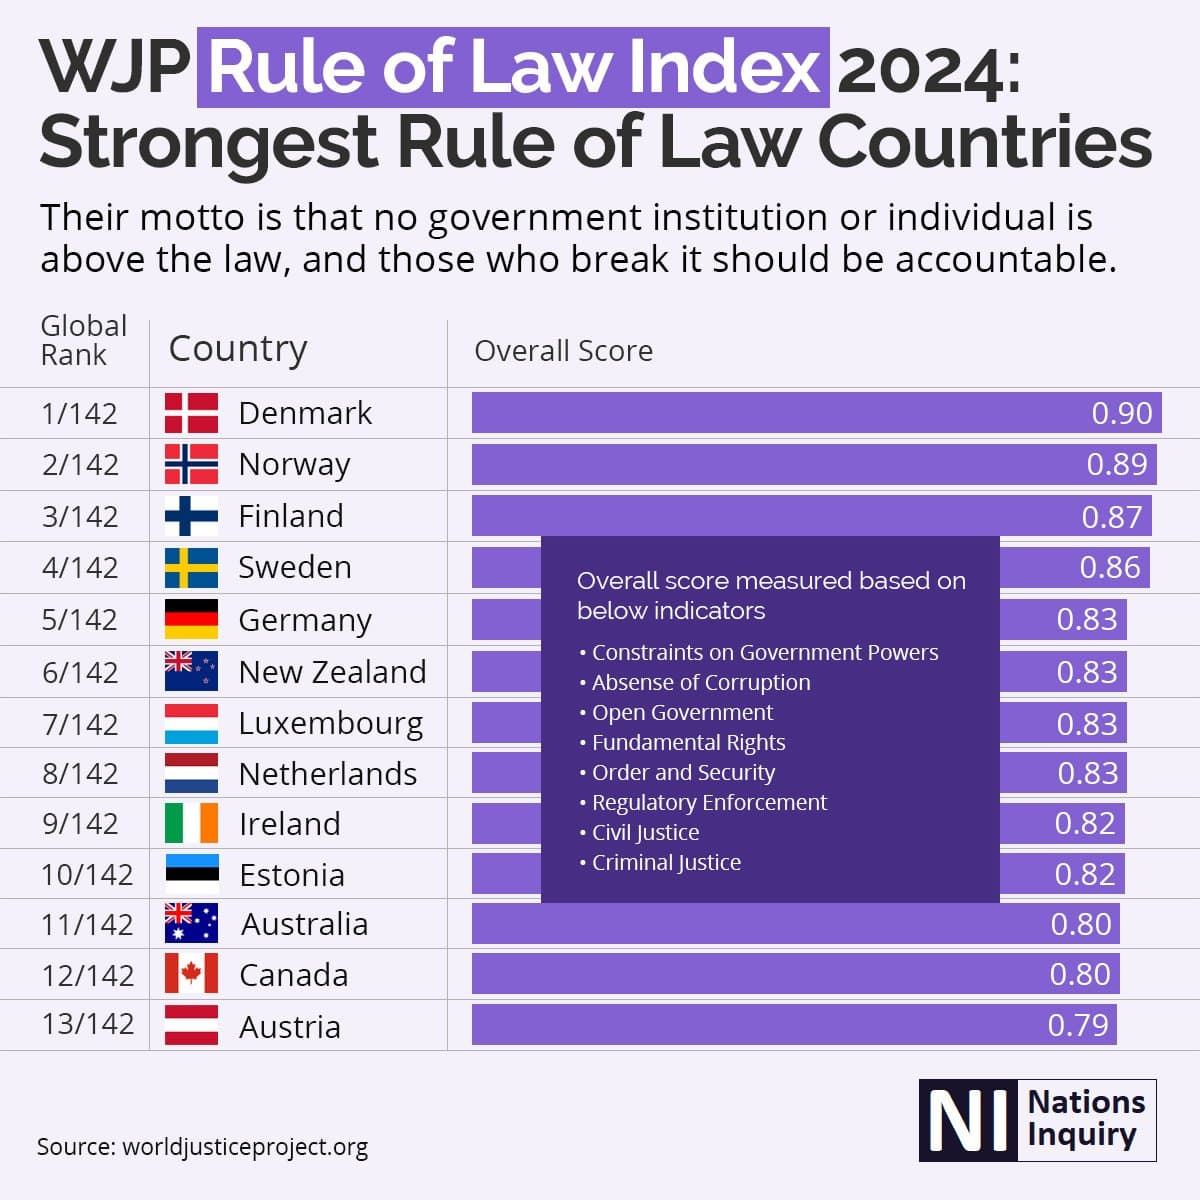
Charts and analysis about Namibia and governance & institutions
08Questions
Namibia on governance & institutions: questions answered
Every answer is built from the numbers on this page, so none can say something the page does not.
How does Namibia rank on governance & institutions?
Namibia is placed joint 84th of 194 countries on Governance & Institutions in the Country Index 2026, from 4 of its 4 key statistics (Government Effectiveness, Statistical Performance Indicators, Corruption Perceptions Index and Judicial Constraints on the Executive Index). The position is this site’s ordering of published statistics, not a rank any publisher printed.
What is the latest Government Effectiveness figure for Namibia?
0.101 in 2025 (governance estimate (−2.5 weak to 2.5 strong)), according to World Bank Group. The world median in the same edition was 0.101.
What is the latest Statistical Performance Indicators figure for Namibia?
55.66 in 2024 (sPI overall score (0–100)), according to World Bank Group. The world median in the same edition was 69.3.
How does Namibia compare with South Africa on governance & institutions?
South Africa is placed joint 54th of 194, and Namibia joint 84th. Government Effectiveness: South Africa -0.023, Namibia 0.101; Statistical Performance Indicators: South Africa 81.29, Namibia 55.66; Corruption Perceptions Index: South Africa 41, Namibia 46; Judicial Constraints on the Executive Index: South Africa 0.895, Namibia 0.811.
How have Namibia’s governance & institutions figures changed?
Government Effectiveness fell from 0.384 in 2000 to 0.101 in 2025; Statistical Performance Indicators rose from 49.87 in 2016 to 55.66 in 2024; Corruption Perceptions Index fell from 48 in 2012 to 46 in 2025; Judicial Constraints on the Executive Index fell from 0.896 in 2000 to 0.811 in 2025.
Which governance & institutions statistics are missing for Namibia?
No current reading is published for Namibia on Business Ready: Operational Efficiency, Business Ready: Public Services, Business Ready: Regulatory Framework, Country Policy and Institutional Assessment, Debt Service on External Debt, External Debt Stocks (% of GNI), Government Funding per Primary Student and Government Spending on Education. They are listed rather than hidden, so the evidence on the page can be checked against it.
09Method
Method, sources and how to cite
What this topic does not measure
Governance is not democracy. Free elections, civil liberties and press freedom belong to the Democracy & Civil Liberties topic, and a country can place well on one and poorly on the other. How openly official data is published sits here as context, beside the statistical capacity that is a key. Nor does this topic measure the size of government or how much it spends — the share of the economy run by the state is published on this page as context, with no better end.
How the Governance & Institutions standing is decided
A standing is this site’s ordering, named with its edition — never a publisher’s rank. 4 key statistics vote, one vote each; every country’s published value becomes a place within that key’s own field, the places are averaged, and the average is never published. A country needs 2 of the 4 keys to be placed.
The governance & institutions method, step by stepHow every standing on this site is built
The key statistics and their licences
- Government Effectiveness — World Bank Group, CC BY 4.0
- Statistical Performance Indicators — World Bank Group, CC BY 4.0
- Corruption Perceptions Index — Transparency International, CC BY 4.0 (the data), CC BY-ND 4.0 (the website and report)
- Judicial Constraints on the Executive Index — V-Dem Institute, University of Gothenburg, CC BY-SA 4.0
The other 37 statistics on this page come from 12 publishers, each named beside its numbers, with every edition and licence on the datasets pages.
The standing itself is part of the Country Index 2026, published under CC BY-SA 4.0.
Photographs
Namibia’s banner and the countries placed highest, from their profiles: Wikimedia Commons, shown in greyscale, each used under the licence named.
- Namibia (banner) — Hans Hillewaert derivative work: Jjtkk, CC BY-SA 3.0
- Denmark — User:Aconcagua, CC BY-SA 3.0
- New Zealand — Karora derivative work: Inkey, Public domain
- Sweden — User:Pieter Kuiper, Public domain
Cite this page
Nations Inquiry (2026). Namibia: Governance & Institutions — standing and statistics, Country Index 2026. https://nationsinquiry.com/countries/namibia/governance