Dataset · World Intellectual Property Organization
Global Innovation Index
4 years, 2022–2025 · 139 countries · 10 measures
WIPO’s Global Innovation Index scores how well an economy turns its inputs — research, institutions, infrastructure, skills — into innovation that reaches the world, out of 100. It is the standard reference for where new ideas are actually being made into products.
This site holds every year from 2022 to 2025, read from World Intellectual Property Organization’s own data and stored exactly as published.
Global Innovation Index · the file
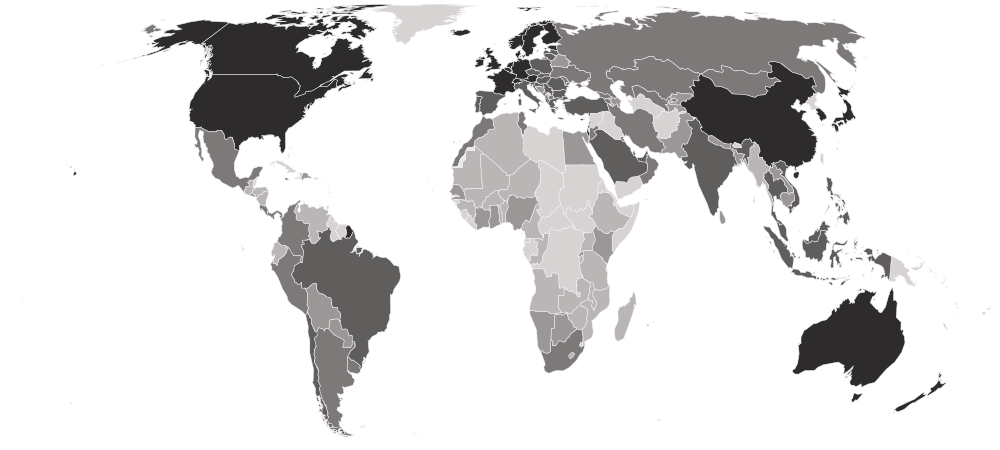
- Newest
- Global Innovation Index, 2025
- Held
- 4 years · 536 rows
- Licence
- CC BY 4.0
014 years
Every year
Newest first. Each opens the full table for that year, and each downloads as a CSV.
| Year | Countries | Change | Read | Download |
|---|---|---|---|---|
| Global Innovation Index, 2025Newest | 139 | +6 | September 6, 2026 | CSV |
| Global Innovation Index, 2024 | 133 | +2 −1 | September 6, 2026 | CSV |
| Global Innovation Index, 2023 | 132 | +3 −3 | September 6, 2026 | CSV |
| Global Innovation Index, 2022 | 132 | — | September 6, 2026 | CSV |
Every year in one file, one row per country per year: global-innovation-index-all-editions-nations-inquiry.csv
0215 columns
What’s in the file
Every column, what it holds, how it is stored and what its values look like — what a reader needs before opening the file.
GII Score (0–100)is built fromInstitutionsHuman Capital and ResearchInfrastructureMarket SophisticationBusiness SophisticationKnowledge and Technology OutputsCreative Outputs
| Column | What it holds | Stored as | Range, 2025 | Distinct | Empty | Spread |
|---|---|---|---|---|---|---|
Global Rankglobal_rankPublisher’s rank | World Intellectual Property Organization’s own rank, exactly as printed. | Number · whole numbers | 1 Switzerland139  Nigermiddle 70 | 139 | 0 | |
EconomycountryName | The country’s name, as this file spells it. | Text | — | 139 | 0 | |
ISO Codecountry_codeIdentifier | The ISO 3166-1 alpha-3 code, added by this site. Every table here joins on it. | Text · 3 letters | — | 139 | 0 | |
GII Score (0–100)gii_scoreHeadline | The headline figure: GII score (0–100). | Number · up to 13 decimals | 11.945Niger65.962Switzerlandmiddle 28.521 | 139 | 0 | |
Innovation Inputsinnovation_inputsMeasure | Sub-index averaging the five input pillars, the conditions that make innovation possible, scored 0–100. | Number · up to 13 decimals | 17.2266Niger68.7455 Singaporemiddle 36.6084 | 139 | 0 | |
InstitutionsinstitutionsPart of the headline | Political, regulatory and business environment in which innovation takes place, scored 0–100. | Number · up to 14 decimals | 1.878 Venezuela98.690Singaporemiddle 48.968 | 139 | 0 | |
Human Capital and Researchhuman_capitalPart of the headline | Schooling, tertiary education, and research and development, scored 0–100. | Number · up to 14 decimals | 5.517 Ethiopia66.991  South Koreamiddle 30.468 | 139 | 0 | |
InfrastructureinfrastructurePart of the headline | Information and communication technologies, general infrastructure and ecological sustainability, scored 0–100. | Number · up to 13 decimals | 11.056 Burkina Faso68.827  Norwaymiddle 41.767 | 139 | 0 | |
Market Sophisticationmarket_sophisticationPart of the headline | Access to credit, investment, trade, diversification and the scale of the domestic market, scored 0–100. | Number · up to 14 decimals | 6.010 Republic of the Congo75.035  United Statesmiddle 35.540 | 139 | 0 | |
Business Sophisticationbusiness_sophisticationPart of the headline | Knowledge workers, links between firms, universities and research, and how well firms absorb knowledge, scored 0–100. | Number · up to 13 decimals | 15.365 Myanmar65.903United Statesmiddle 27.961 | 139 | 0 | |
Innovation Outputsinnovation_outputsMeasure | Sub-index averaging the two output pillars, the results that innovation produces, scored 0–100. | Number · up to 14 decimals | 4.920 Lesotho64.453Switzerlandmiddle 20.736 | 139 | 0 | |
Knowledge and Technology Outputsknowledge_outputsPart of the headline | Creation, impact and spread of knowledge, from patents and scientific articles to high-tech exports, scored 0–100. | Number · up to 14 decimals | 5.456 Angola60.705  Chinamiddle 20.578 | 139 | 0 | |
Creative Outputscreative_outputsPart of the headline | Intangible assets such as trademarks and designs, creative goods and services, and online creativity, scored 0–100. | Number · up to 15 decimals | 2.003Niger68.798Switzerlandmiddle 22.337 | 139 | 0 | |
Income Groupincome_groupGrouping | World Intellectual Property Organization’s own grouping of the country. | Text | — | 4 | 1 | |
RegionregionGrouping | World Intellectual Property Organization’s own grouping of the country. | Text | — | 7 | 0 |
Profiled from the newest file. Range: the lowest and highest value, with the country holding it when only one does. Spread: countries in ten equal steps from lowest to highest. A higher value is the better result.
03141 countries across every year
Who is covered
How many countries each year holds, continent by continent, who joined and who left, and which places this site covers that the dataset never has.
| 2022 | 2023 | 2024 | 2025 | |
|---|---|---|---|---|
| Africa | 31 | 32 | 31 | 36 |
| Americas | 20 | 21 | 22 | 23 |
| Asia | 40 | 38 | 39 | 39 |
| Europe | 39 | 39 | 39 | 39 |
| Oceania | 2 | 2 | 2 | 2 |
| All | 132 | 132 | 133 | 139 |
Who joined and who left
 + Guinea
 + Malawi
 + Seychelles
 + Barbados
 + Bolivia
 + Cabo Verde
 + Lebanon
 − Iraq
 − Yemen
Not in this dataset · 84 places this site covers
World Intellectual Property Organization gives no figure for these in any year held here. It is the publisher’s choice of scope, and each place’s profile shows what is measured.
 Afghanistan
 American Samoa
 Andorra
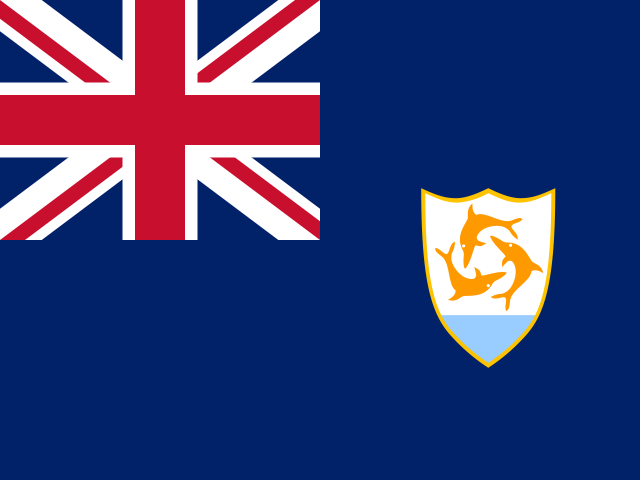 Anguilla
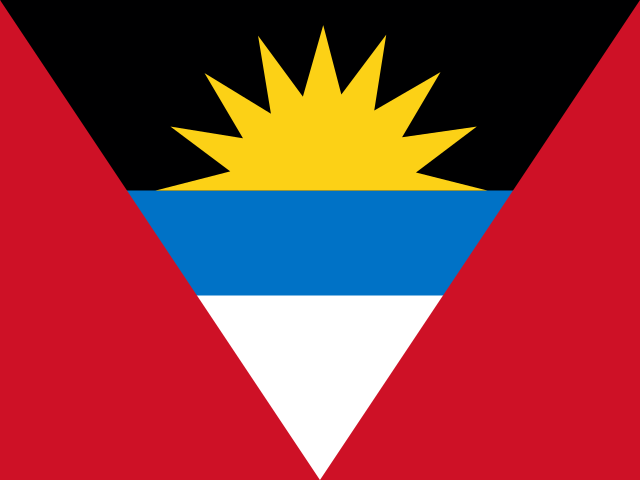 Antigua and Barbuda
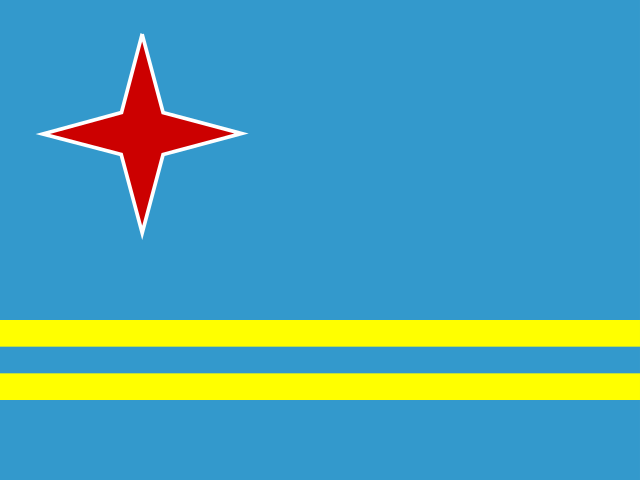 Aruba
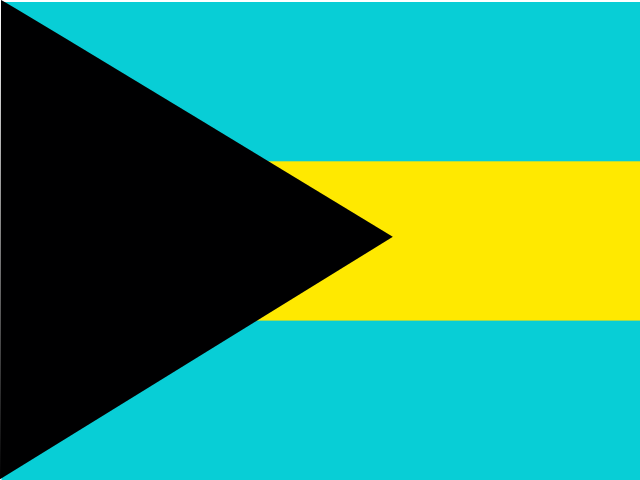 Bahamas
 Belize
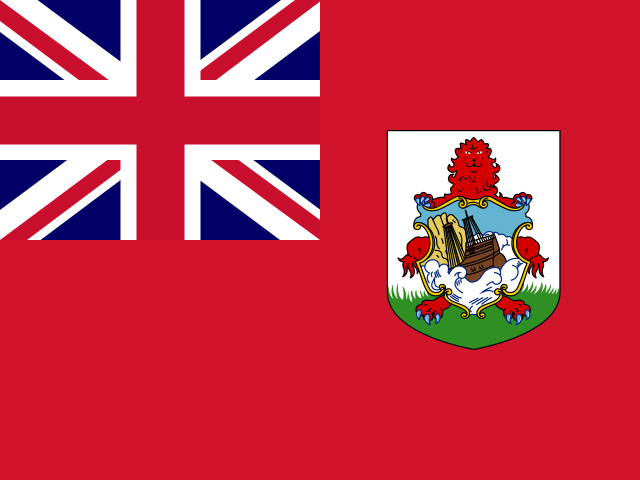 Bermuda
 Bhutan
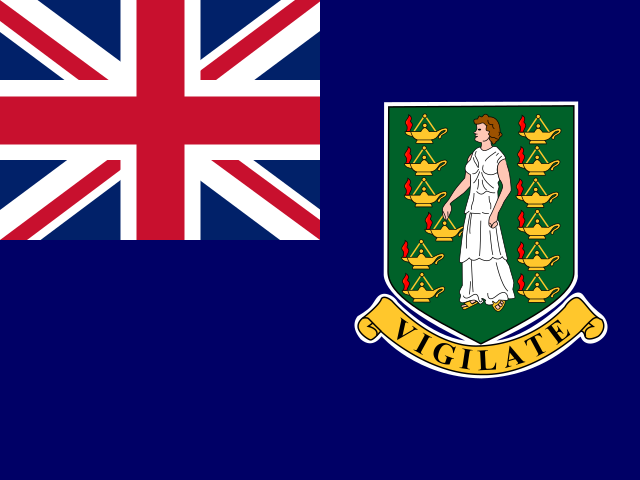 British Virgin Islands
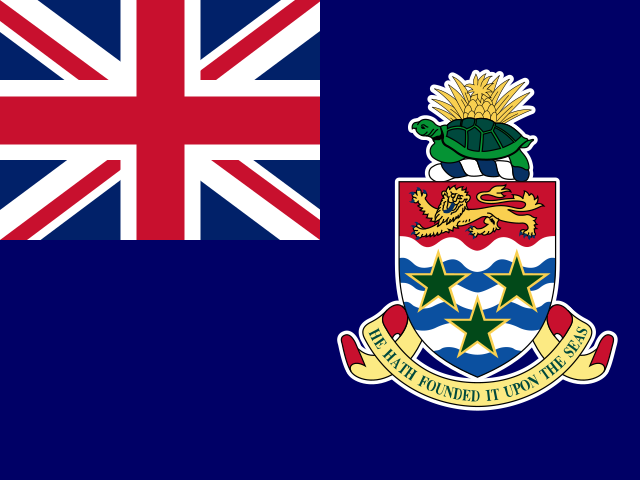 Cayman Islands
 Central African Republic
 ChadChannel Islands
 Comoros
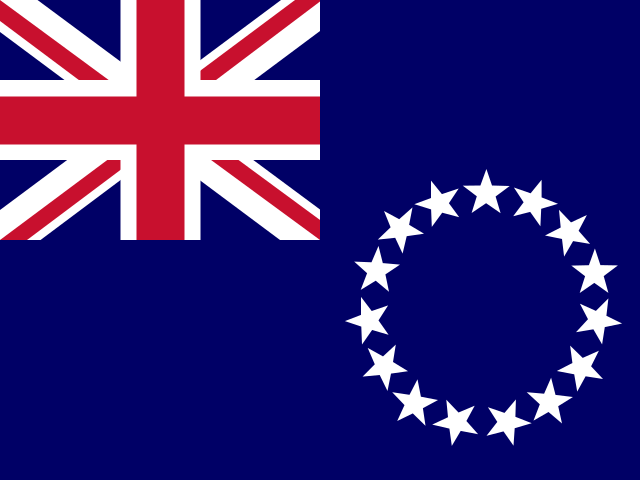 Cook Islands
 Cuba
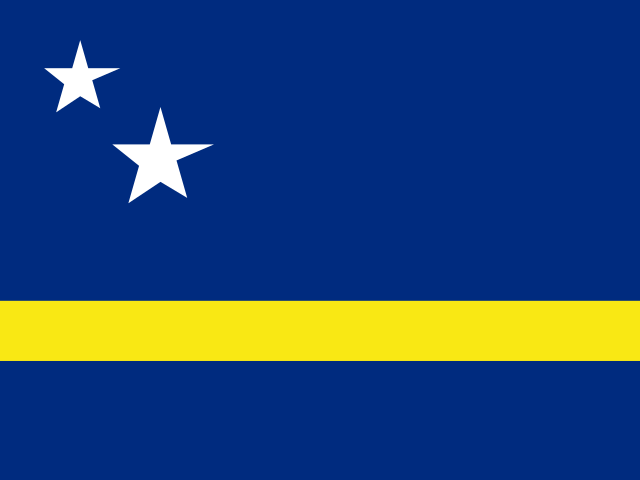 Curaçao
 Djibouti
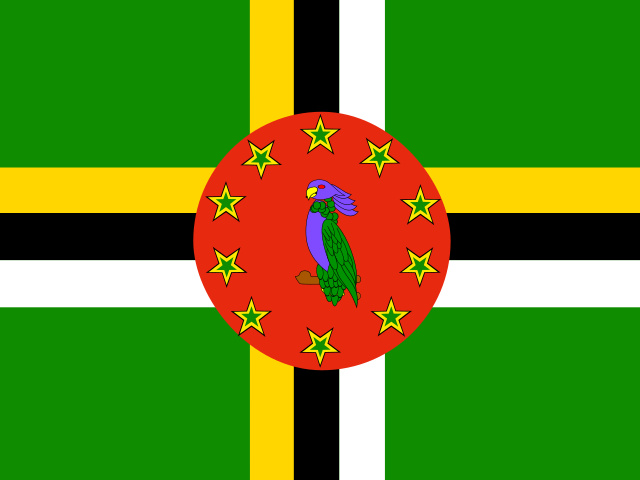 Dominica
 DR Congo
 Equatorial Guinea
 Eritrea
 Eswatini
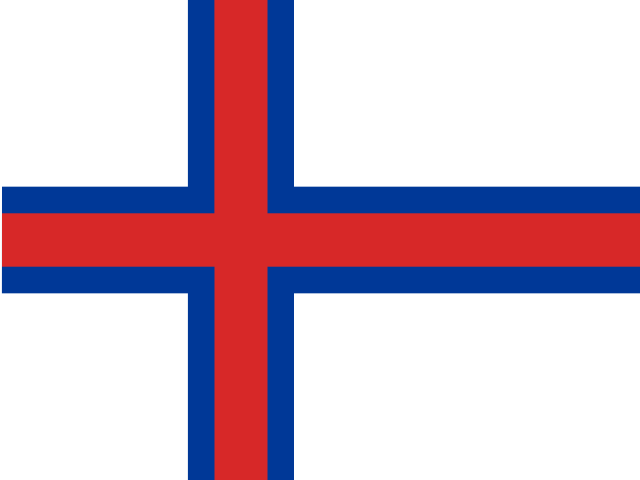 Faroe Islands
 Fiji
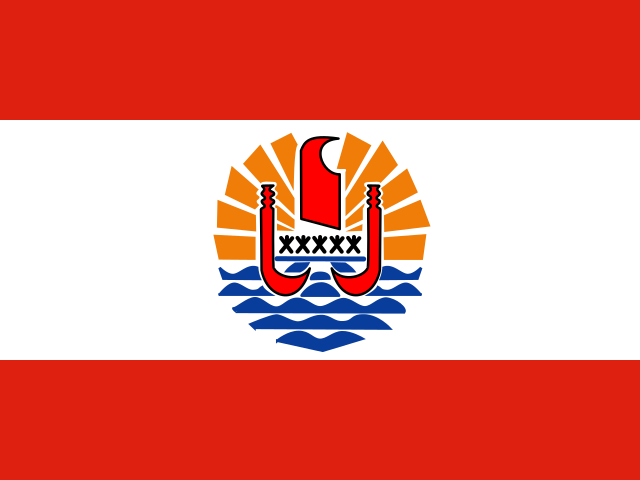 French Polynesia
 Gabon
 Gambia
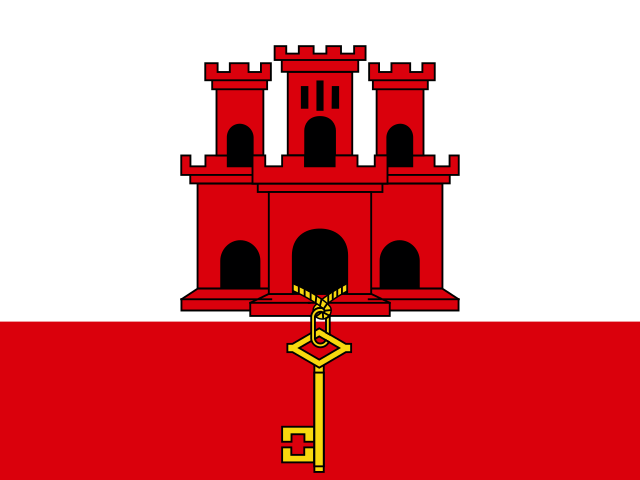 Gibraltar
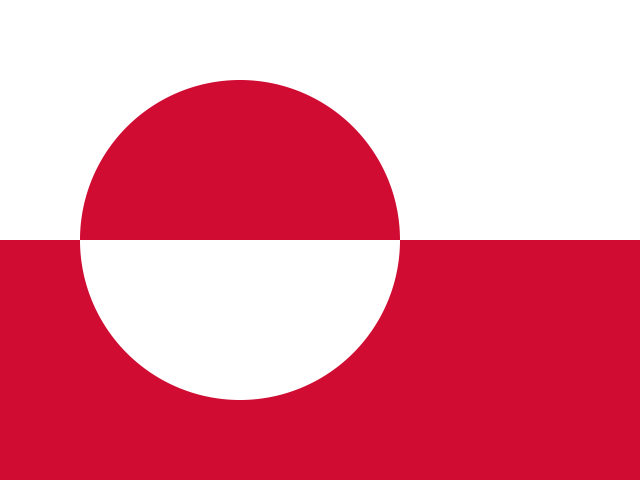 Greenland
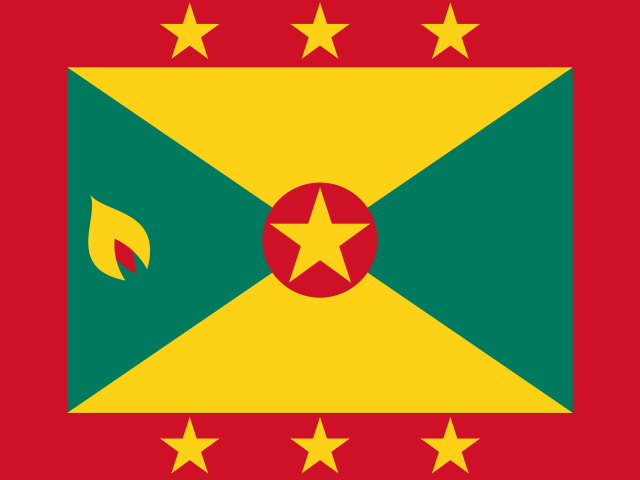 Grenada
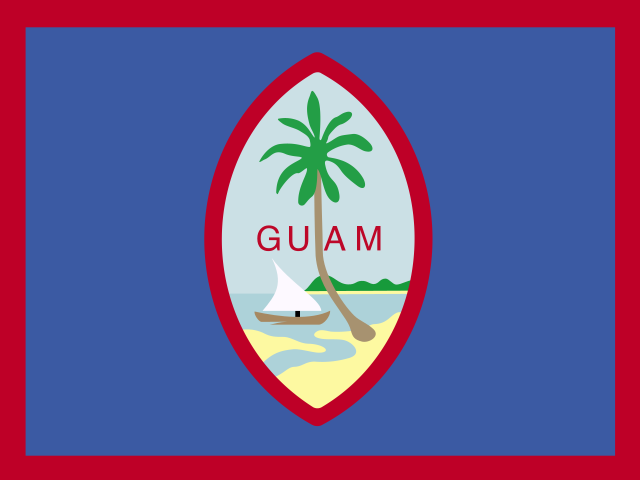 Guam
 Guinea-Bissau
 Guyana
 Haiti
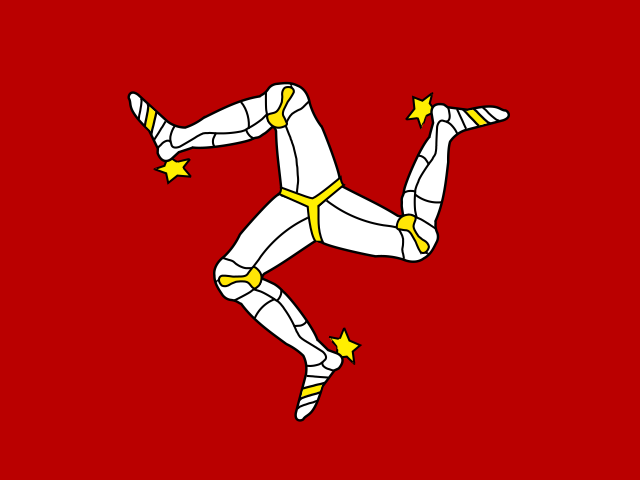 Isle of Man
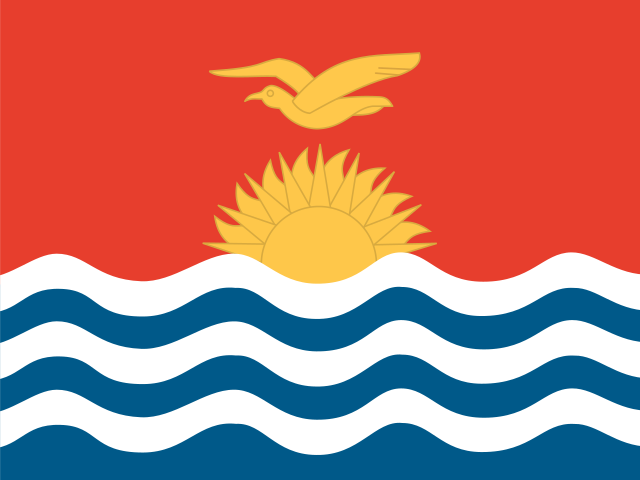 Kiribati
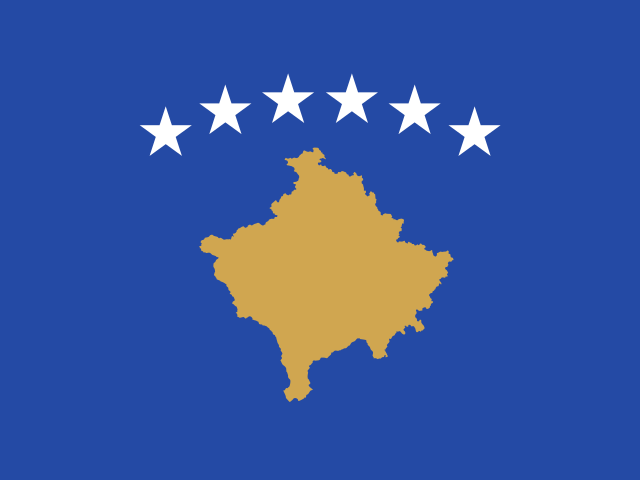 Kosovo
 Liberia
 Libya
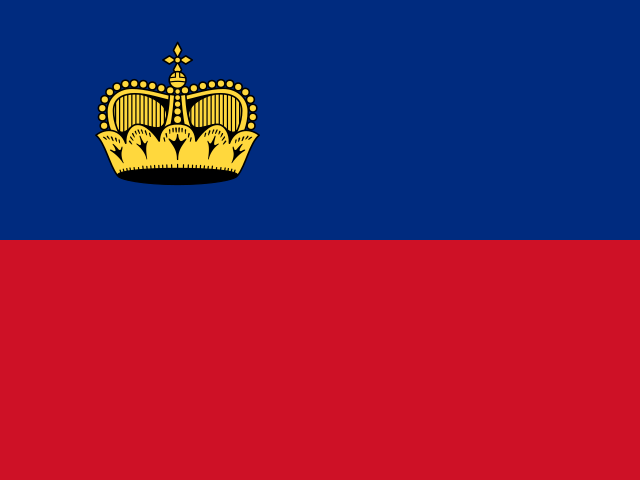 Liechtenstein
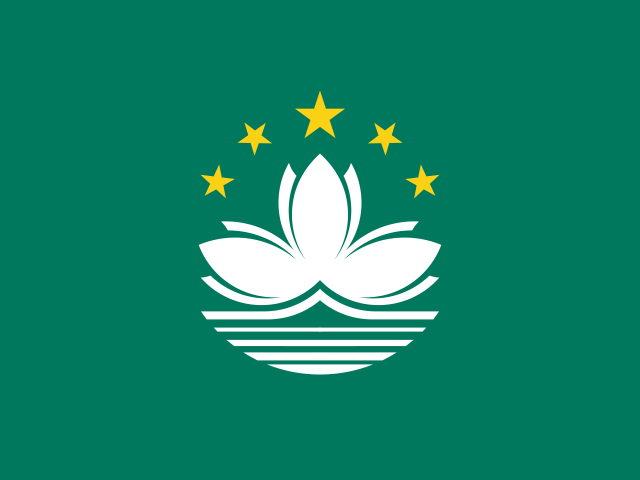 Macau
 Maldives
 Marshall Islands
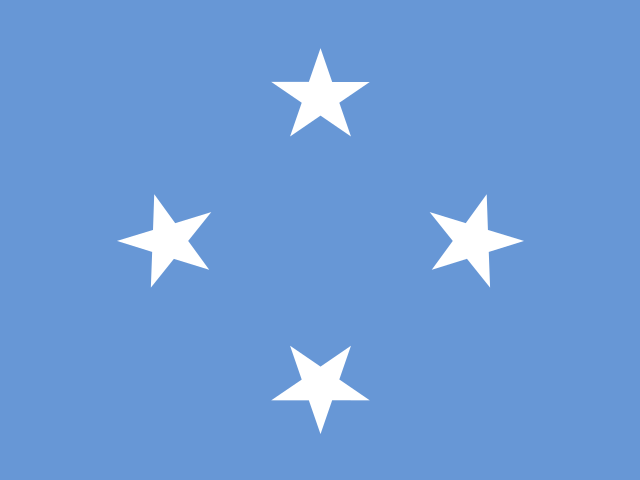 Micronesia
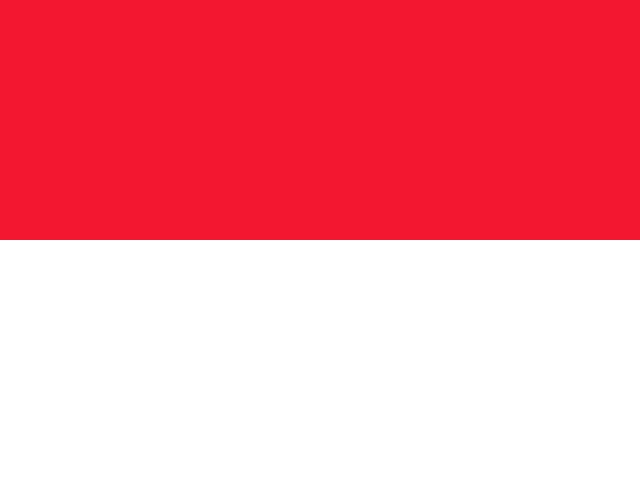 Monaco
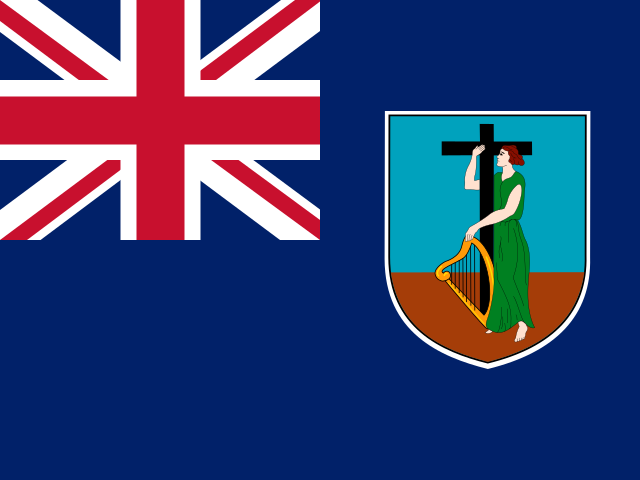 Montserrat
 Nauru
 New Caledonia
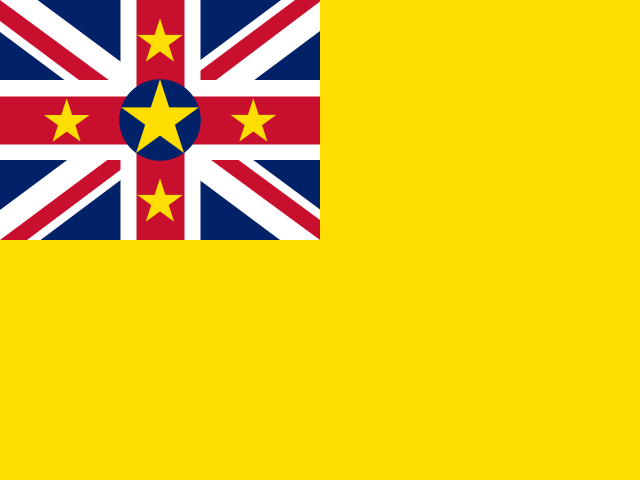 Niue
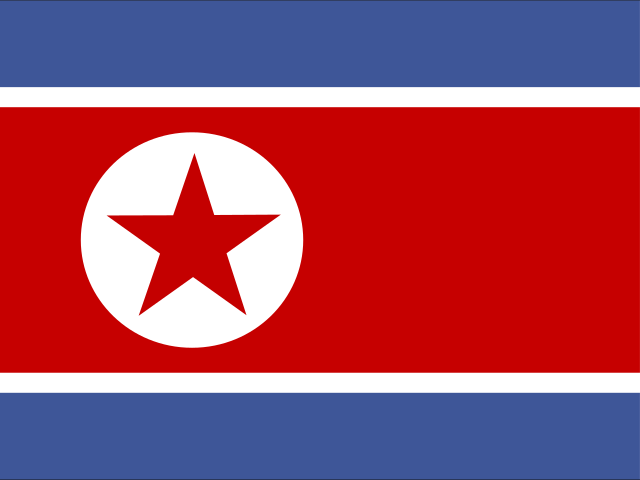 North KoreaNorthern Cyprus
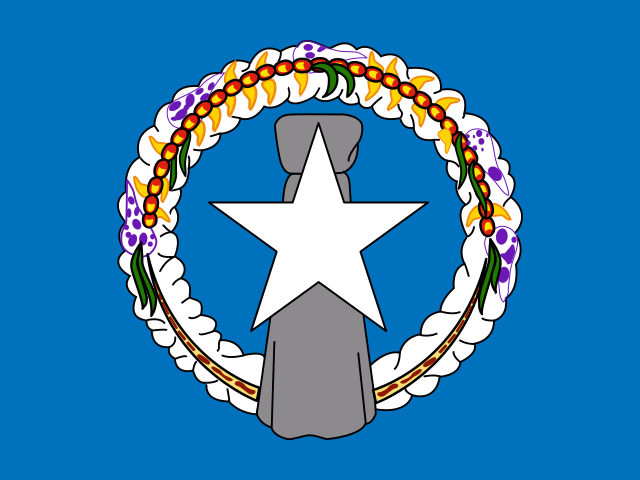 Northern Mariana Islands
 Palau
 Palestine
 Papua New Guinea
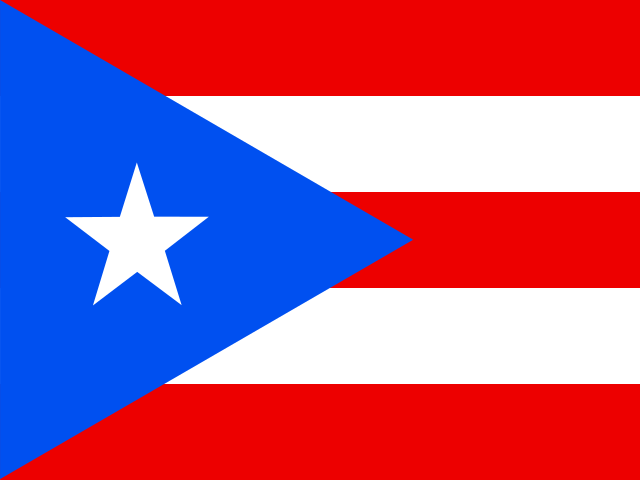 Puerto Rico
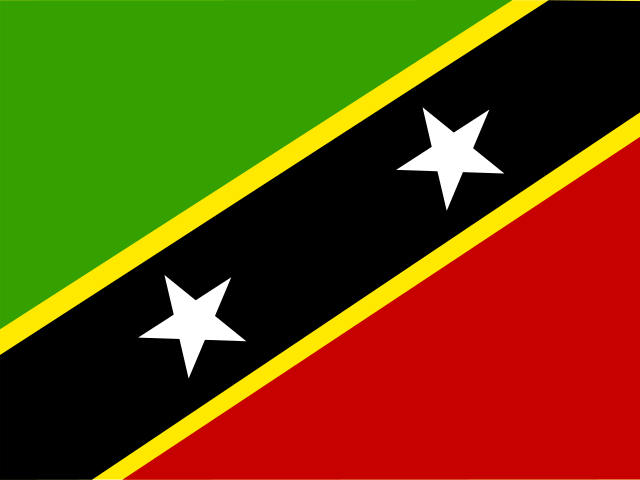 Saint Kitts and Nevis
 Saint Lucia
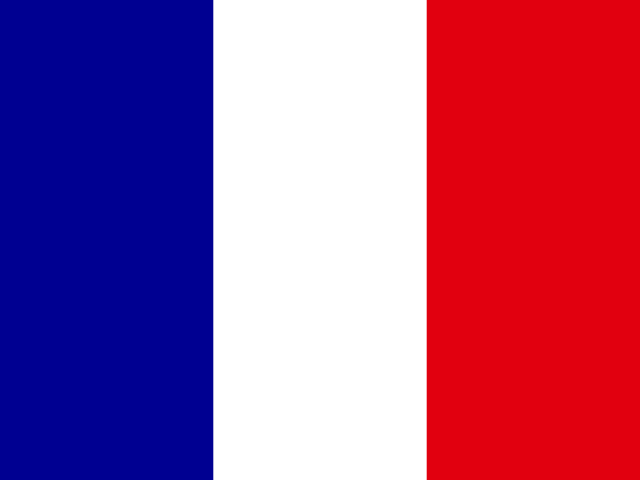 Saint Martin
 Saint Vincent and the Grenadines
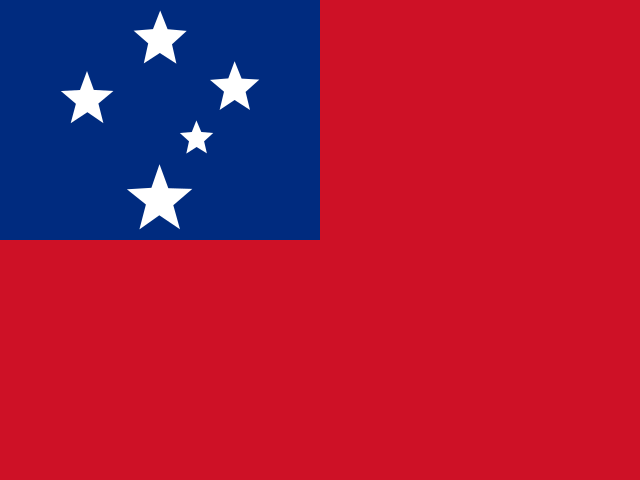 Samoa
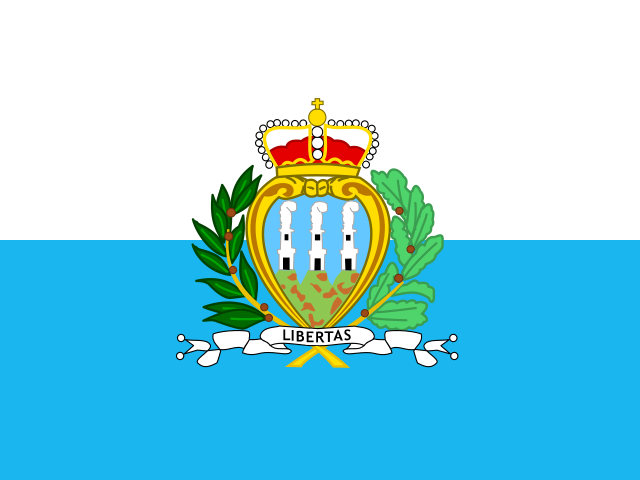 San Marino
 São Tomé and Príncipe
 Sierra Leone
 Sint Maarten
 Solomon Islands
 SomaliaSomaliland
 South Sudan
 Sudan
 Suriname
 Syria
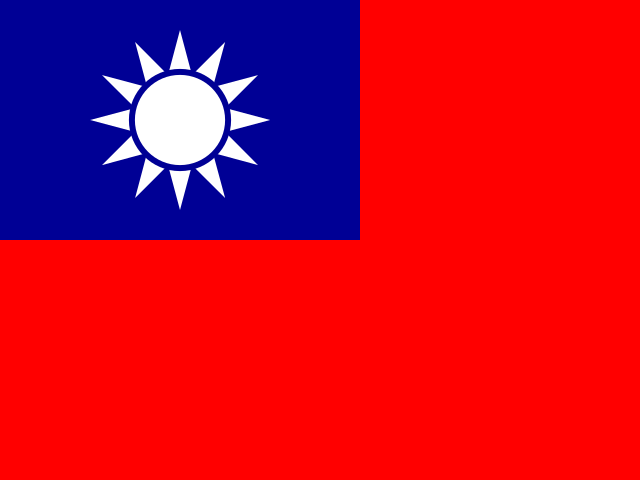 Taiwan
 Timor-Leste
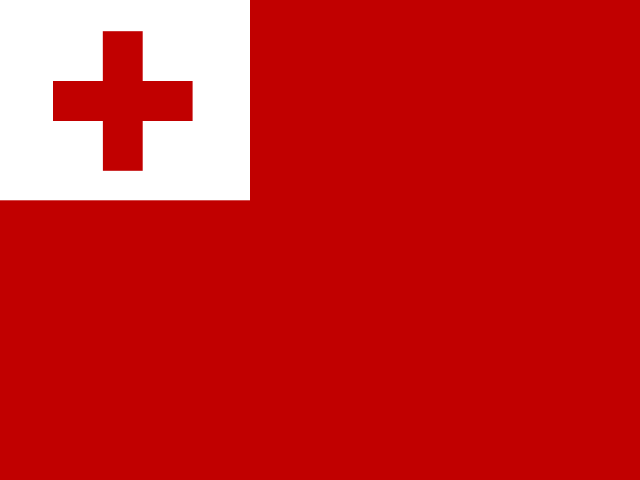 Tonga
 Turkmenistan
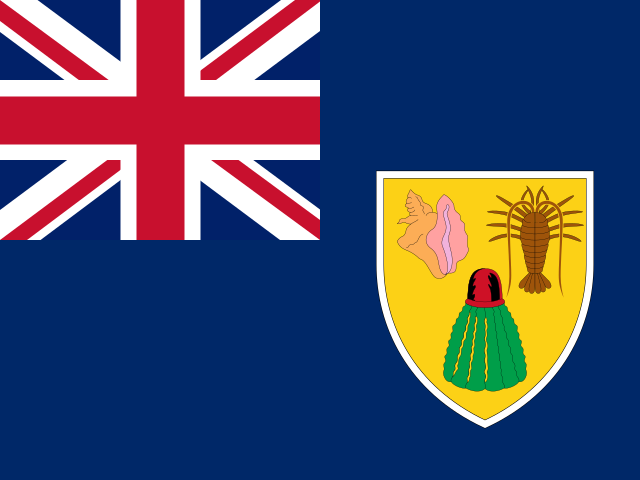 Turks and Caicos Islands
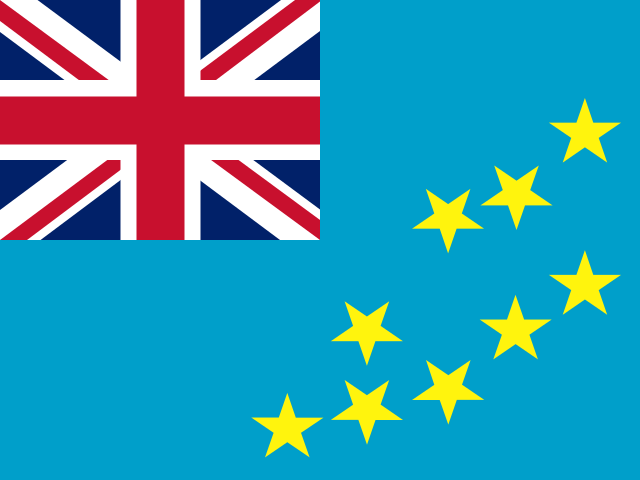 Tuvalu
 United States Virgin Islands
 Vanuatu
 Vatican City
04Provenance
Where it comes from
The path from the publisher to this page, and what was checked and changed on the way.
1 · Publisher
World Intellectual Property Organization
2 · Their file
Global Innovation Index 2025
3 · Read by this site
September 6, 2026
Imported by a script that parses each figure and writes it down unrounded.4 · Stored as
4 files, one per year
Each downloads as a CSV, or every year together as global-innovation-index-all-editions-nations-inquiry.csv5 · Used on
Its statistic page, and every profile it measures
Precision
The headline is stored to 13 decimals, as published.
Rounded by this site
Never. Tables on screen may show fewer decimals; the files never do.
Changed by this site
Reshaped into one row per country: regional and income-group totals are left out, only the columns listed are kept, each row gets its ISO 3166 code, and some country names are brought to one spelling. No value is recalculated, rescaled or rounded.
Imported from WIPO’s own data annex, one download per edition. The series starts at 2022 because WIPO changed its publication numbering and the earlier annexes are not at a matching URL.
05Reuse
Licence and credit
What the publisher’s licence lets you do, what it asks of you, and a credit line and citation ready to copy.
Licence · checked August 29, 2026
- Share and redistribute it
- Adapt it and build on it
- Use it commercially
- Credit the publisher
- Say what you changed
Share, adapt and use commercially. Credit the publisher and say if you changed anything.
A credit line
Source: World Intellectual Property Organization, Global Innovation Index, via Nations Inquiry.
Cite this dataset
World Intellectual Property Organization. Global Innovation Index, 2022–2025 [data set]. As held by Nations Inquiry, https://nationsinquiry.com/datasets/global-innovation-index
The publisher’s own citation: WIPO. Global Innovation Index. Geneva: World Intellectual Property Organization.
Plain-language summary, not legal advice. The licence text is what binds.
06Questions
Global Innovation Index: questions and answers
What is the Global Innovation Index?
WIPO’s Global Innovation Index scores how well an economy turns its inputs — research, institutions, infrastructure, skills — into innovation that reaches the world, out of 100. It is the standard reference for where new ideas are actually being made into products.
Which years of the Global Innovation Index can I download?
All 4, from 2022 to 2025, each as a CSV file, or every year together in one CSV.
Does World Intellectual Property Organization rank countries on it?
Yes. The rank in these files is World Intellectual Property Organization’s own, exactly as printed.
Can I use it commercially?
Yes, under CC BY 4.0, with credit to World Intellectual Property Organization. The licence text is linked on this page.