ILO · Gini Index of Monthly Earnings
Earnings inequality by country
How unequally is pay spread among a country’s employees?
Of the 75 countries compared in 2024, Bosnia and Herzegovina had the lowest reading, 0.182, and Lesotho had the highest reading, 0.643. In the middle country the figure was 0.337. Among the 40 countries measured in every edition since 2009, the middle one moved from 0.342 to 0.324.
Earnings inequality · 2024
Context statistic

Lowest of 75Bosnia and Herzegovina
0.182012024 · position · derived
Who leads
The three countries at the lowest end of 75 compared, the three at the other end, and the first on each continent.
 1
1Photo: Goran Anđelić Derivative work by Globe-trotter · CC BY-SA 3.0, greyscale
 2
2Photo: Teogomez Teo Gomez · CC0, greyscale
 3
3Photo: Madalin Pentelie · CC0, greyscale
02Every measured country
Earnings inequality on a map
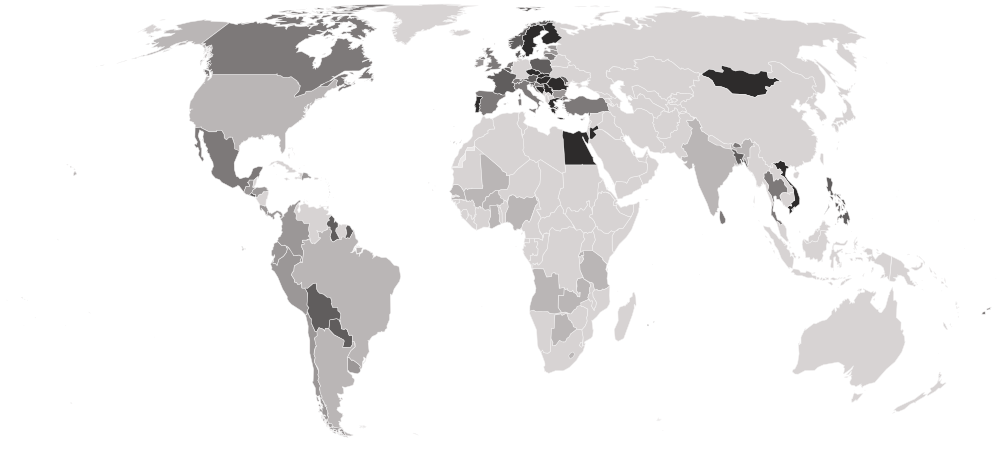
Each country is shaded by its value, in five groups holding the same number of countries. Hover a country for its value, or select it to open its profile. Below the map, each continent’s middle country.
Darker is a lower value — the better end.
- 0.429–0.643
- 0.349–0.426
- 0.324–0.344
- 0.268–0.323
- 0.182–0.262
- No reading in 2024 (71 measured in an earlier edition)
- Europe
0.282
the middle country, of 30 measured · 49 members
Bosnia and Herzegovina0.182 Ireland0.400
Lowest and highest reading in Europe.
- Asia
0.314
the middle country, of 12 measured · 52 members
 Jordan0.220
 India0.429
Lowest and highest reading in Asia.
- Americas
0.368
the middle country, of 19 measured · 48 members
 Guyana0.304
 Brazil0.448
Lowest and highest reading in Americas.
- Africa
0.528
the middle country, of 13 measured · 55 members
 Egypt0.229
 Lesotho0.643
Lowest and highest reading in Africa.
- Oceania
1 of 21 measured — too few for a middle: Fiji.
 Fiji0.344
Lowest and highest reading in Oceania.
- Every region
18 sub-regions, lowest middle country first
- Eastern Europe
0.257
the middle country, of 7 measured · 10 members
 Romania0.224
 Bulgaria0.390
Lowest and highest reading in Eastern Europe.
- Southern Europe
0.269
the middle country, of 8 measured · 17 members
Bosnia and Herzegovina0.1822 share 0.332
Lowest and highest reading in Southern Europe.
- Western Europe
0.319
the middle country, of 6 measured · 9 members
 Belgium0.269
 Luxembourg0.344
Lowest and highest reading in Western Europe.
- Northern Europe
0.340
the middle country, of 9 measured · 13 members
 Finland0.256Ireland0.400
Lowest and highest reading in Northern Europe.
- South America
0.368
the middle country, of 10 measured · 12 members
Guyana0.304Brazil0.448Lowest and highest reading in South America.
- Central America
0.388
the middle country, of 6 measured · 8 members
 El Salvador0.323
 Honduras0.426
Lowest and highest reading in Central America.
- Western Africa
0.500
the middle country, of 5 measured · 16 members
 Nigeria0.447
 Senegal0.598
Lowest and highest reading in Western Africa.
- Caribbean
1 of 24 measured — too few for a middle: Dominican Republic.
 Dominican Republic0.367
Lowest and highest reading in Caribbean.
- Eastern Africa
4 of 19 measured — too few for a middle: Mauritius, Rwanda, Tanzania, Zambia.
 Mauritius0.344
 Tanzania0.568
Lowest and highest reading in Eastern Africa.
- Eastern Asia
1 of 8 measured — too few for a middle: Mongolia.
 Mongolia0.259
Lowest and highest reading in Eastern Asia.
- Melanesia
1 of 5 measured — too few for a middle: Fiji.
Fiji0.344Lowest and highest reading in Melanesia.
- Middle Africa
1 of 9 measured — too few for a middle: Angola.
 Angola0.515
Lowest and highest reading in Middle Africa.
- Northern Africa
1 of 6 measured — too few for a middle: Egypt.
Egypt0.229Lowest and highest reading in Northern Africa.
- Northern America
2 of 4 measured — too few for a middle: Canada, United States.
 Canada0.334
 United States0.430
Lowest and highest reading in Northern America.
- South-eastern Asia
3 of 11 measured — too few for a middle: Philippines, Thailand, Vietnam.
 Vietnam0.227
 Thailand0.325
Lowest and highest reading in South-eastern Asia.
- Southern Africa
2 of 5 measured — too few for a middle: Botswana, Lesotho.
 Botswana0.621Lesotho0.643
Lowest and highest reading in Southern Africa.
- Southern Asia
4 of 9 measured — too few for a middle: Bangladesh, Bhutan, India, Sri Lanka.
 Bangladesh0.302India0.429
Lowest and highest reading in Southern Asia.
- Western Asia
4 of 19 measured — too few for a middle: Cyprus, Jordan, Palestine, Türkiye.
Jordan0.220 Cyprus0.367
Lowest and highest reading in Western Asia.
03The whole field at once
The spread
75 countries, one dot each, on one scale — further right is a higher value. Half the countries are above 0.337; a quarter are above 0.394, and a quarter below 0.282. The bar in each row marks that continent’s middle country.
04All 146 ever measured
Every country
In order, highest value first — position 1 is the highest value, the way ILO’s own tables read. “=” marks a position shared with another country. International Labour Organization (ILO) ranks nobody on this measure; the position is derived here by ordering the published values. This is not the household income Gini. It covers employees only, before taxes and benefits, and leaves out the self-employed and income from savings and property — so a country can look equal here and unequal in household income, or the reverse.
Showing 25 of 146 countries















































































































Values for 2024. The change column compares 2024 with 2023 only; the sparkline covers the recent editions.
052009–2024 · 16 reference years
Over time
Each point is one year of a survey. Countries survey on different schedules, so a line can have gaps, and a “Break in series” flag in the data marks a change of survey that can move the level by itself.
- the middle country
- the middle half of countries
- the middle of the 40 countries measured every time
- each continent’s middle country
The same, year by year
| Year | Countries | Middle country | Middle half | Measured every time |
|---|---|---|---|---|
| 2024 | 75 | 0.337 | 0.282 – 0.394 | 0.324 |
| 2023 | 82 | 0.342 | 0.286 – 0.392 | 0.319 |
| 2022 | 86 | 0.357 | 0.296 – 0.417 | 0.327 |
| 2021 | 80 | 0.347 | 0.282 – 0.396 | 0.327 |
| 2020 | 76 | 0.345 | 0.284 – 0.392 | 0.326 |
| 2019 | 94 | 0.355 | 0.292 – 0.414 | 0.337 |
| 2018 | 80 | 0.349 | 0.293 – 0.389 | 0.343 |
| 2017 | 83 | 0.354 | 0.292 – 0.383 | 0.345 |
| 2016 | 80 | 0.352 | 0.299 – 0.391 | 0.340 |
| 2015 | 75 | 0.351 | 0.298 – 0.391 | 0.338 |
| 2014 | 83 | 0.365 | 0.304 – 0.420 | 0.331 |
| 2013 | 77 | 0.357 | 0.299 – 0.408 | 0.339 |
| 2012 | 77 | 0.356 | 0.299 – 0.428 | 0.341 |
| 2011 | 75 | 0.354 | 0.306 – 0.407 | 0.340 |
| 2010 | 72 | 0.360 | 0.312 – 0.403 | 0.335 |
| 2009 | 60 | 0.356 | 0.308 – 0.396 | 0.342 |
062023 → 2024
Who rose and fell
The biggest changes in value between the two newest editions — reference years recalculated in one report, not two separate publications. Places are shown second, because they also move when other countries do.
Improved most
before → after Ghana0.671 → 0.498 · 1st → 10th−0.173
- Mauritius0.391 → 0.344 · 22nd → 31st−0.047
 Sri Lanka0.383 → 0.338 · 27th → 37th−0.045
 Burkina Faso0.564 → 0.528 · 6th → 6th−0.036
- Bangladesh0.336 → 0.302 · 44th → 52nd−0.034
Worsened most
before → after- Senegal0.443 → 0.598 · 13th → 3rd+0.155
 Slovakia0.205 → 0.257 · 82nd → 65th+0.052
- United States0.388 → 0.430 · 23rd → 14th+0.042
- Egypt0.212 → 0.229 · 81st → 70th+0.017
 Argentina0.425 → 0.441 · 17th → 13th+0.016
69 countries were measured in both 2023 and 2024. The field changed from 82 to 75 countries, so a place can move for reasons that have nothing to do with the country itself.
07Across every edition
Earnings inequality in records
The extremes of the statistic. A record reached by more than one country names none of them.
Highest reading on record
0.849
Gini index of employees’ monthly earnings (0 = all paid the same, 1 = maximum inequality)
Lowest reading on record
0.182
Gini index of employees’ monthly earnings (0 = all paid the same, 1 = maximum inequality)
Biggest improvement between editions
−0.311
0.659 → 0.348
Biggest decline between editions
+0.155
0.443 → 0.598
Most improved since first measured
−0.430
0.659 → 0.229
At the top most often
2 countries share this record — no holder is named
6 of 16
editions
08The measure
About earnings inequality
This measures how unequally pay is spread among a country’s employees, on a scale from 0, where every employee earns the same, to 1, where one employee earns everything. It is the wage part of inequality, computed by the International Labour Organization from earnings surveys.
What the number is: Gini index of employees’ monthly earnings (0 = all paid the same, 1 = maximum inequality).
What it does not measure
It covers employees’ pay only, before taxes and benefits, so it leaves out the self-employed, income from savings and property, and how households share what they earn.
09Where it fits
Connections
Its part in the Country Index, the statistics whose values line up most closely with it across countries, and others on the same subject.
In the Country Index
Context, with no vote
This statistic is published in full under Work & Labour and Poverty & Inequality, but does not help decide any Country Index standing.
Work & LabourPoverty & InequalityWhich statistics vote, and why
Moves with
Where earnings inequality is higher, these tend to be higher too.
No statistic lines up this closely.
Moves against
Where earnings inequality is higher, these tend to be lower.
No statistic lines up this closely.
Rank correlation (ρ, from −1 to 1) across countries, on each statistic’s newest edition, out of 0 statistics sharing at least 80 countries with this one. Two statistics that move together do not cause each other.
10Keep reading
Explore further
The subject
11Questions
Earnings inequality: questions and answers
Which country has the lowest earnings inequality?
Bosnia and Herzegovina, at 0.182, among the 75 countries compared in 2024.
Which country has the highest earnings inequality?
Lesotho, at 0.643, among the 75 countries compared in 2024.
How many countries does the Gini Index of Monthly Earnings cover?
75 in 2024, and 146 at least once across all editions. The number measured varies from 60 to 94 between editions.
What is the world average earnings inequality?
This site does not calculate a world average, which would depend on how countries are weighted. In the middle country of the 75 compared in 2024, the figure was 0.337.
Is this International Labour Organization (ILO)’s own ranking?
No. International Labour Organization (ILO) publishes the values but ranks nobody; the position on this page is derived by Nations Inquiry by ordering the published values, and equal values share a position.
How often is the Gini Index of Monthly Earnings published?
This site holds 16 reference years, 2009–2024, all recalculated in International Labour Organization (ILO)’s 2026 report on one method — not 16 separate publications.
Where does the data come from, and can I download it?
From International Labour Organization (ILO), under CC BY 4.0. Read from ILOSTAT directly. A few country-years that ILOSTAT fills with a placeholder of −1 are left out. Every edition is on this site’s Datasets pages as a full table, and downloads as a CSV file with every value unrounded.
12Method
Sources, method and citation
Source
Gini Index of Monthly Earnings — International Labour Organization (ILO)
Read from ILOSTAT directly. A few country-years that ILOSTAT fills with a placeholder of −1 are left out.
Newest edition
Report year 2024Data year 2024
Cite the source as: International Labour Organization. ILOSTAT. Geneva: ILO.
Licence: CC BY 4.0, checked 2026-09-29.
How this page reads the numbers
- International Labour Organization (ILO) ranks nobody on this measure. The position is derived by Nations Inquiry by ordering the published values; equal values share a position.
- Which end is better follows the publisher’s own reading of the measure.
- A country is named at an end only when it holds that value alone. Where several share it, the page says how many and names none first.
- Values are stored exactly as published and trimmed only for display. “The middle country” is the median of the countries measured, not a world average.
The file itself, column by column — where it came from, what each column holds, and every edition as a CSV — is on its dataset page.
Photographs
The countries at the top of this statistic, from their profiles: Wikimedia Commons, shown in greyscale, each used under the licence named.
- Bosnia and Herzegovina — Goran Anđelić Derivative work by Globe-trotter, CC BY-SA 3.0
- Jordan — Teogomez Teo Gomez, CC0
- Romania — Madalin Pentelie, CC0
Cite this page
Nations Inquiry (2026). Earnings inequality by country: Gini Index of Monthly Earnings, data from International Labour Organization (ILO). https://nationsinquiry.com/statistics/earnings-gini