Data for 1998
Participatory Democracy Index, 1998
1998, as V-Dem Institute’s 2026 release gives it · stored as published, never rewritten
V-Dem's Participatory Democracy Index asks how far citizens take part in politics beyond electing representatives — through civil society organisations, referendums and citizens' initiatives, and elected local and regional government — while also requiring genuine national elections. It runs from 0 to 1, and a higher figure is more democratic.
Participatory Democracy Index, 1998 covers 173 countries. Switzerland is highest, at 0.793; Bahrain is lowest, at 0.011. The middle country reads 0.276. Against 1997, 112 values changed (52 up, 60 down), 1 country joined.
Participatory Democracy Index · Data for 1998
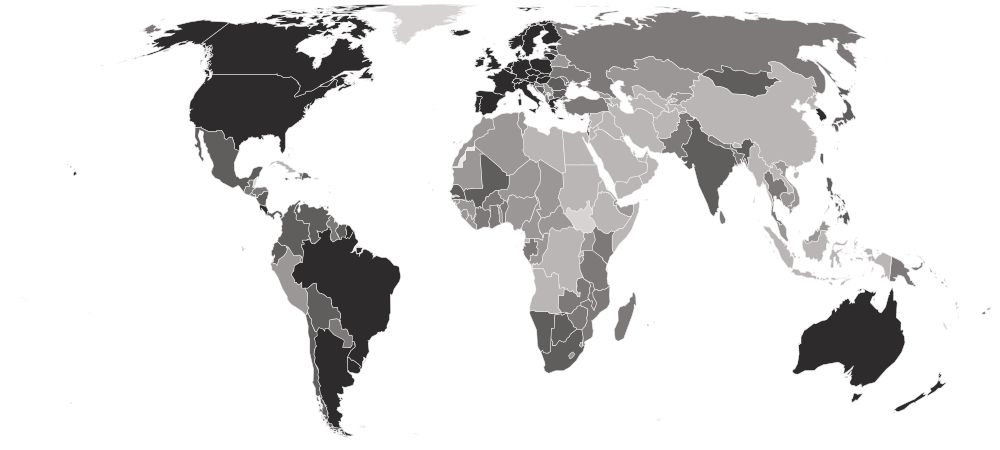

HighestSwitzerland
0.793
LowestBahrain
0.011Shaded by value in five groups of equal size, darkest at the better end.
01Position · derived
The table
Every country and every column of Participatory Democracy Index, 1998, as published. V-Dem Institute ranks nobody on this measure; the position is derived here by ordering the published values. “=” marks a shared position.
Showing 25 of 173 countries · select a heading to sort
| derived | ||
|---|---|---|
| 1 | SwitzerlandCHEWestern Europe | 0.793 |
| 2 |  Uruguay URYSouth America | 0.745 |
| 3 |  Denmark DNKNorthern Europe | 0.733 |
| 4 |  New Zealand NZLAustralia and New Zealand | 0.707 |
| 5 |  Sweden SWENorthern Europe | 0.689 |
| 6 |  Norway NORNorthern Europe | 0.662 |
| =7 |  Italy ITASouthern Europe | 0.652 |
| =7 |  Slovenia SVNSouthern Europe | 0.652 |
| 9 |  Germany DEUWestern Europe | 0.649 |
| 10 |  France FRAWestern Europe | 0.645 |
| 11 |  Poland POLEastern Europe | 0.643 |
| 12 |  Finland FINNorthern Europe | 0.642 |
| 13 |  Spain ESPSouthern Europe | 0.639 |
| =14 |  Austria AUTWestern Europe | 0.634 |
| =14 |  Belgium BELWestern Europe | 0.634 |
| 16 |  Hungary HUNEastern Europe | 0.632 |
| 17 |  Ireland IRLNorthern Europe | 0.630 |
| 18 |  Costa Rica CRICentral America | 0.629 |
| 19 |  United States USANorthern America | 0.627 |
| 20 |  Australia AUSAustralia and New Zealand | 0.620 |
| 21 |  Portugal PRTSouthern Europe | 0.617 |
| 22 |  Iceland ISLNorthern Europe | 0.615 |
| 23 |  Estonia ESTNorthern Europe | 0.614 |
| 24 |  Lithuania LTUNorthern Europe | 0.607 |
| 25 |  Greece GRCSouthern Europe | 0.600 |
| 26 |  Canada CANNorthern America | 0.595 |
| 27 |  Brazil BRASouth America | 0.591 |
| 28 |  Luxembourg LUXWestern Europe | 0.587 |
| 29 |  Slovakia SVKEastern Europe | 0.579 |
| 30 |  Netherlands NLDWestern Europe | 0.575 |
| 31 |  Czechia CZEEastern Europe | 0.572 |
| 32 |  Argentina ARGSouth America | 0.571 |
| 33 |  South Korea KOREastern Asia | 0.567 |
| 34 |  United Kingdom GBRNorthern Europe | 0.561 |
| 35 |  Latvia LVANorthern Europe | 0.558 |
| 36 |  Chile CHLSouth America | 0.556 |
| 37 |  Japan JPNEastern Asia | 0.554 |
| 38 |  Israel ISRWestern Asia | 0.520 |
| 39 |  Malta MLTSouthern Europe | 0.515 |
| 40 |  Suriname SURSouth America | 0.507 |
| 41 |  Cyprus CYPWestern Asia | 0.493 |
| 42 |  India INDSouthern Asia | 0.490 |
| 43 |  Trinidad and Tobago TTOCaribbean | 0.482 |
| 44 |  Ecuador ECUSouth America | 0.481 |
| 45 |  Venezuela VENSouth America | 0.474 |
| 46 |  Botswana BWASouthern Africa | 0.466 |
| 47 |  Cabo Verde CPVWestern Africa | 0.460 |
| =48 |  Mauritius MUSEastern Africa | 0.458 |
| =48 |  South Africa ZAFSouthern Africa | 0.458 |
| 50 |  Bulgaria BGREastern Europe | 0.442 |
| 51 |  Panama PANCentral America | 0.441 |
| 52 |  Bolivia BOLSouth America | 0.436 |
| 53 |  Taiwan TWNEastern Asia | 0.433 |
| 54 |  Jamaica JAMCaribbean | 0.420 |
| 55 |  Namibia NAMSouthern Africa | 0.414 |
| 56 |  Dominican Republic DOMCaribbean | 0.413 |
| 57 |  Mongolia MNGEastern Asia | 0.401 |
| 58 |  São Tomé and Príncipe STPMiddle Africa | 0.400 |
| 59 |  Philippines PHLSouth-eastern Asia | 0.397 |
| 60 |  Romania ROUEastern Europe | 0.391 |
| 61 |  Nicaragua NICCentral America | 0.388 |
| 62 |  Vanuatu VUTMelanesia | 0.375 |
| 63 |  Colombia COLSouth America | 0.372 |
| =64 |  Mali MLIWestern Africa | 0.365 |
| =64 |  Senegal SENWestern Africa | 0.365 |
| 66 |  Mexico MEXCentral America | 0.355 |
| 67 |  Bosnia and Herzegovina BIHSouthern Europe | 0.338 |
| 68 |  Barbados BRBCaribbean | 0.324 |
| 69 |  Paraguay PRYSouth America | 0.323 |
| =70 |  Guyana GUYSouth America | 0.322 |
| =70 |  Moldova MDAEastern Europe | 0.322 |
| 72 |  Türkiye TURWestern Asia | 0.319 |
| =73 |  Ghana GHAWestern Africa | 0.317 |
| =73 |  Madagascar MDGEastern Africa | 0.317 |
| =73 |  Papua New Guinea PNGMelanesia | 0.317 |
| 76 |  Tanzania TZAEastern Africa | 0.314 |
| =77 |  Guatemala GTMCentral America | 0.312 |
| =77 |  Zambia ZMBEastern Africa | 0.312 |
| 79 |  El Salvador SLVCentral America | 0.304 |
| =80 |  Honduras HNDCentral America | 0.302 |
| =80 |  Sri Lanka LKASouthern Asia | 0.302 |
| 82 |  North Macedonia MKDSouthern Europe | 0.298 |
| 83 |  Benin BENWestern Africa | 0.291 |
| 84 |  Fiji FJIMelanesia | 0.290 |
| 85 |  Russia RUSEastern Europe | 0.288 |
| 86 |  Solomon Islands SLBMelanesia | 0.287 |
| =87 |  Malawi MWIEastern Africa | 0.276 |
| =87 |  Mozambique MOZEastern Africa | 0.276 |
| 89 |  Haiti HTICaribbean | 0.254 |
| 90 |  Albania ALBSouthern Europe | 0.252 |
| 91 |  Burkina Faso BFAWestern Africa | 0.251 |
| =92 |  Comoros COMEastern Africa | 0.248 |
| =92 |  Côte d’Ivoire CIVWestern Africa | 0.248 |
| =92 |  Croatia HRVSouthern Europe | 0.248 |
| =92 |  Ukraine UKREastern Europe | 0.248 |
| 96 |  Bangladesh BGDSouthern Asia | 0.236 |
| 97 |  Gabon GABMiddle Africa | 0.235 |
| 98 |  Thailand THASouth-eastern Asia | 0.231 |
| 99 |  Montenegro MNESouthern Europe | 0.223 |
| 100 |  Nepal NPLSouthern Asia | 0.222 |
| 101 |  Kenya KENEastern Africa | 0.213 |
| 102 |  Pakistan PAKSouthern Asia | 0.209 |
| 103 |  Zimbabwe ZWEEastern Africa | 0.207 |
| 104 |  Armenia ARMWestern Asia | 0.205 |
| =105 |  Peru PERSouth America | 0.204 |
| =105 |  Uganda UGAEastern Africa | 0.204 |
| 107 |  Lesotho LSOSouthern Africa | 0.188 |
| 108 |  Serbia SRBSouthern Europe | 0.185 |
| 109 |  Niger NERWestern Africa | 0.182 |
| 110 |  Nigeria NGAWestern Africa | 0.175 |
| 111 |  Vietnam VNMSouth-eastern Asia | 0.168 |
| 112 |  Liberia LBRWestern Africa | 0.167 |
| 113 |  Malaysia MYSSouth-eastern Asia | 0.166 |
| 114 |  Central African Republic CAFMiddle Africa | 0.162 |
| =115 |  Gambia GMBWestern Africa | 0.154 |
| =115 |  Sierra Leone SLEWestern Africa | 0.154 |
| 117 |  Guinea GINWestern Africa | 0.150 |
| 118 |  Cameroon CMRMiddle Africa | 0.148 |
| 119 |  Guinea-Bissau GNBWestern Africa | 0.145 |
| 120 |  Hong Kong HKGEastern Asia | 0.142 |
| 121 |  Belarus BLREastern Europe | 0.140 |
| =122 |  Burundi BDIEastern Africa | 0.134 |
| =122 |  Chad TCDMiddle Africa | 0.134 |
| 124 |  Seychelles SYCEastern Africa | 0.132 |
| 125 |  Togo TGOWestern Africa | 0.129 |
| 126 |  Cambodia KHMSouth-eastern Asia | 0.127 |
| 127 |  Eswatini SWZSouthern Africa | 0.126 |
| 128 |  Algeria DZANorthern Africa | 0.122 |
| 129 |  Georgia GEOWestern Asia | 0.121 |
| 130 |  Tunisia TUNNorthern Africa | 0.118 |
| =131 |  Kyrgyzstan KGZCentral Asia | 0.116 |
| =131 |  Lebanon LBNWestern Asia | 0.116 |
| 133 |  Mauritania MRTWestern Africa | 0.115 |
| 134 |  Djibouti DJIEastern Africa | 0.114 |
| =135 |  Republic of the Congo COGMiddle Africa | 0.110 |
| =135 | SomalilandXSLEastern Africa | 0.110 |
| =137 |  Kazakhstan KAZCentral Asia | 0.108 |
| =137 |  Morocco MARNorthern Africa | 0.108 |
| 139 |  Rwanda RWAEastern Africa | 0.107 |
| 140 |  Bhutan BTNSouthern Asia | 0.104 |
| 141 |  Singapore SGPSouth-eastern Asia | 0.097 |
| 142 |  DR Congo CODMiddle Africa | 0.096 |
| 143 |  Indonesia IDNSouth-eastern Asia | 0.095 |
| 144 |  Ethiopia ETHEastern Africa | 0.094 |
| 145 |  Kuwait KWTWestern Asia | 0.092 |
| 146 |  Laos LAOSouth-eastern Asia | 0.091 |
| 147 |  Jordan JORWestern Asia | 0.083 |
| 148 |  Tajikistan TJKCentral Asia | 0.081 |
| 149 |  Azerbaijan AZEWestern Asia | 0.077 |
| 150 |  Egypt EGYNorthern Africa | 0.075 |
| 151 |  Yemen YEMWestern Asia | 0.073 |
| =152 |  Maldives MDVSouthern Asia | 0.069 |
| =152 |  Somalia SOMEastern Africa | 0.069 |
| =152 |  Turkmenistan TKMCentral Asia | 0.069 |
| 155 |  Sudan SDNNorthern Africa | 0.066 |
| 156 |  Iran IRNSouthern Asia | 0.065 |
| 157 |  Angola AGOMiddle Africa | 0.062 |
| 158 |  Uzbekistan UZBCentral Asia | 0.056 |
| =159 |  Oman OMNWestern Asia | 0.050 |
| =159 |  Syria SYRWestern Asia | 0.050 |
| 161 |  Equatorial Guinea GNQMiddle Africa | 0.048 |
| =162 |  Iraq IRQWestern Asia | 0.044 |
| =162 |  Libya LBYNorthern Africa | 0.044 |
| =164 |  Cuba CUBCaribbean | 0.043 |
| =164 |  Myanmar MMRSouth-eastern Asia | 0.043 |
| =164 |  North Korea PRKEastern Asia | 0.043 |
| 167 |  China CHNEastern Asia | 0.038 |
| 168 |  Saudi Arabia SAUWestern Asia | 0.019 |
| 169 |  Eritrea ERIEastern Africa | 0.018 |
| =170 |  Qatar QATWestern Asia | 0.014 |
| =170 |  United Arab Emirates AREWestern Asia | 0.014 |
| 172 |  Afghanistan AFGSouthern Asia | 0.013 |
| 173 | BahrainBHRWestern Asia | 0.011 |
02In 1998
At either end
The 5 countries at each end of the headline.
Highest
- 1Switzerland0.793
- 2Uruguay0.745
- 3Denmark0.733
- 4New Zealand0.707
- 5Sweden0.689
Lowest
- 173Bahrain0.011
- 172Afghanistan0.013
- 170Qatarshared0.014
- 170United Arab Emiratesshared0.014
- 169Eritrea0.018
A higher value is the better result. The middle country reads 0.276. “Shared” marks a value another country also holds.
031997 → 1998
Since 1997
- +1 / −0countries joined / left
- 112values changed, of 172 in both
- 52 · 60rose · fell
- 60unchanged
Rose most
- Guyana0.235 → 0.322+0.087
- South Korea0.483 → 0.567+0.084
- Mozambique0.193 → 0.276+0.083
- Slovakia0.520 → 0.579+0.059
- Indonesia0.047 → 0.095+0.048
Fell most
- Ukraine0.283 → 0.248−0.035
- Republic of the Congo0.142 → 0.110−0.032
- Sierra Leone0.180 → 0.154−0.026
- Mali0.387 → 0.365−0.022
- Venezuela0.492 → 0.474−0.018
+ Montenegro04Caveats
Read before you use
One year of the 2026 release
Every year in this series comes from V-Dem Institute’s 2026 release, recalculated on one method, so a change from one year to the next is not a revision. It can differ from what was first published for 1998.
147 distinct values among 173
Values are stored exactly as published, to 3 decimals. 4 countries share 0.248. Countries sharing a value share a position too.
Nothing missing
Every one of the 173 countries has every column.
05The files
Download and cite
- .csv
For a spreadsheet or code
173 rows · 4.7 KB · UTF-8, opens in Excel
Opens with 11 lines of source notes; the table starts on row 13.
Download participatory-democracy-1998-nations-inquiry.csv - ↗
The publisher’s original
V-Dem Institute’s own file, on its own site.
V-Dem-CY-Core-v16_csv.zip
What this site changed: Reshaped to one row per country, with its ISO code; no value recalculated, rescaled or rounded. In full
Licence: CC BY-SA 4.0 · what it allows, in plain words
Cite this edition
V-Dem Institute, University of Gothenburg (1998). Participatory Democracy Index, 1998 [data set], describing 1998. As held by Nations Inquiry, https://nationsinquiry.com/datasets/participatory-democracy/1998
0636 held
Other years
‹ The year before
Participatory Democracy Index, 1997172 countries
The year after ›
Participatory Democracy Index, 1999174 countries
All of them
Participatory Democracy Index: every year36 held, with the data dictionary, coverage and licence.
How it has moved, charted by country