Data for 2002
Water Withdrawal by Sector, 2002
2002, as FAO’s 2026 release gives it · stored as published, never rewritten
Water Withdrawal by Sector, 2002 covers 155 countries on 3 measures. Somalia is highest, at 99.555; 2 countries share the lowest reading, 0.000. The middle country reads 61.484. Against 2001, 139 values changed (38 up, 101 down), 4 countries joined, 4 left.
Water Withdrawal by Sector · Data for 2002
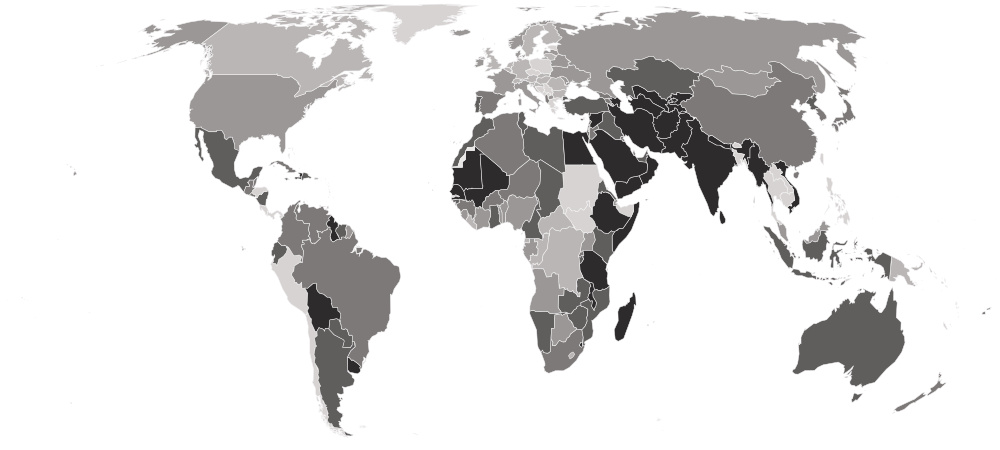

HighestSomalia
99.555Lowest2 countries share it
0.000Shaded by value in five groups of equal size, darkest at the highest end.
01Position · derived
The table
Every country and every column of Water Withdrawal by Sector, 2002, as published. FAO ranks nobody on this measure; the position is derived here by ordering the published values. “=” marks a shared position.
Showing 25 of 155 countries · select a heading to sort
| derived | ||||
|---|---|---|---|---|
| 1 | SomaliaSOMEastern Africa | 99.555 | 0.405 | 0.0404 |
| 2 |  Afghanistan AFGSouthern Asia | 98.431 | 0.856 | 0.7131 |
| 3 |  Mali MLIWestern Africa | 98.114 | 1.767 | 0.1196 |
| 4 |  Nepal NPLSouthern Asia | 97.731 | 1.891 | 0.3779 |
| 5 |  Madagascar MDGEastern Africa | 96.980 | 1.951 | 1.0686 |
| 6 |  Turkmenistan TKMCentral Asia | 96.519 | 2.397 | 1.0844 |
| 7 |  Guyana GUYSouth America | 96.478 | 2.642 | 0.8799 |
| 8 |  Eswatini SWZSouthern Africa | 95.591 | 2.938 | 1.4709 |
| 9 |  Vietnam VNMSouth-eastern Asia | 94.334 | 1.466 | 4.1995 |
| 10 |  Pakistan PAKSouthern Asia | 94.297 | 4.017 | 1.6861 |
| 11 |  Ethiopia ETHEastern Africa | 93.631 | 5.991 | 0.3778 |
| 12 |  Kyrgyzstan KGZCentral Asia | 93.539 | 3.067 | 3.3940 |
| 13 |  Senegal SENWestern Africa | 92.976 | 4.412 | 2.6114 |
| 14 |  Iran IRNSouthern Asia | 92.959 | 5.886 | 1.1548 |
| 15 |  Mauritania MRTWestern Africa | 92.424 | 5.682 | 1.8940 |
| 16 |  Tajikistan TJKCentral Asia | 92.189 | 4.165 | 3.6457 |
| 17 |  Bolivia BOLSouth America | 91.307 | 6.614 | 2.0789 |
| 18 |  India INDSouthern Asia | 91.226 | 6.994 | 1.7798 |
| 19 |  Uzbekistan UZBCentral Asia | 90.326 | 6.078 | 3.5964 |
| 20 |  Yemen YEMWestern Asia | 90.306 | 7.767 | 1.9273 |
| 21 |  Sri Lanka LKASouthern Asia | 90.290 | 4.776 | 4.9332 |
| 22 |  Tanzania TZAEastern Africa | 89.352 | 10.166 | 0.4823 |
| 23 |  Oman OMNWestern Asia | 89.105 | 9.195 | 1.6992 |
| 24 |  Myanmar MMRSouth-eastern Asia | 88.821 | 9.981 | 1.1977 |
| 25 |  Azerbaijan AZEWestern Asia | 88.164 | 6.180 | 5.6558 |
| 26 |  Syria SYRWestern Asia | 88.086 | 8.436 | 3.4782 |
| 27 |  Saudi Arabia SAUWestern Asia | 88.014 | 9.918 | 2.0673 |
| 28 |  Malawi MWIEastern Africa | 87.144 | 9.641 | 3.2152 |
| 29 |  Haiti HTICaribbean | 86.960 | 11.007 | 2.0332 |
| 30 |  Egypt EGYNorthern Africa | 86.276 | 8.599 | 5.1253 |
| 31 |  Uruguay URYSouth America | 85.566 | 11.022 | 3.4120 |
| 32 |  Suriname SURSouth America | 85.439 | 5.588 | 8.9729 |
| 33 |  Dominican Republic DOMCaribbean | 84.488 | 12.720 | 2.7922 |
| 34 |  Eritrea ERIEastern Africa | 84.388 | 9.313 | 6.2990 |
| 35 |  Ecuador ECUSouth America | 84.228 | 11.072 | 4.7007 |
| 36 |  Libya LBYNorthern Africa | 82.848 | 14.101 | 3.0513 |
| 37 |  Tunisia TUNNorthern Africa | 81.778 | 13.961 | 4.2609 |
| 38 |  United Arab Emirates AREWestern Asia | 81.532 | 16.116 | 2.3515 |
| 39 |  Nicaragua NICCentral America | 81.016 | 15.304 | 3.6804 |
| 40 |  Iraq IRQWestern Asia | 79.954 | 6.216 | 13.8303 |
| 41 |  Guinea-Bissau GNBWestern Africa | 79.558 | 15.160 | 5.2818 |
| 42 |  Indonesia IDNSouth-eastern Asia | 79.218 | 10.082 | 10.6996 |
| 43 |  Zimbabwe ZWEEastern Africa | 78.906 | 14.007 | 7.0868 |
| 44 |  Türkiye TURWestern Asia | 78.726 | 12.533 | 8.7406 |
| 45 |  Chad TCDMiddle Africa | 78.039 | 10.980 | 10.9803 |
| 46 |  Burundi BDIEastern Africa | 77.938 | 16.374 | 5.6874 |
| 47 |  Mexico MEXCentral America | 77.273 | 13.223 | 9.5041 |
| 48 |  North Korea PRKEastern Asia | 76.892 | 10.186 | 12.9216 |
| 49 |  Cyprus CYPWestern Asia | 75.939 | 21.798 | 2.2629 |
| 50 |  Mozambique MOZEastern Africa | 75.530 | 21.411 | 3.0588 |
| 51 |  Portugal PRTSouthern Europe | 74.895 | 9.745 | 15.3593 |
| 52 |  Morocco MARNorthern Africa | 74.582 | 20.248 | 5.1701 |
| 53 |  Paraguay PRYSouth America | 73.769 | 17.918 | 8.3134 |
| 54 |  Zambia ZMBEastern Africa | 73.282 | 18.448 | 8.2697 |
| 55 |  Kenya KENEastern Africa | 72.743 | 22.493 | 4.7643 |
| 56 |  Cameroon CMRMiddle Africa | 72.597 | 19.245 | 8.1580 |
| 57 |  Argentina ARGSouth America | 71.362 | 16.120 | 12.5185 |
| 58 |  Namibia NAMSouthern Africa | 70.107 | 24.890 | 5.0024 |
| 59 |  Mauritius MUSEastern Africa | 69.818 | 25.977 | 4.2048 |
| 60 |  Australia AUSAustralia and New Zealand | 68.361 | 20.891 | 10.7473 |
| 61 |  Kazakhstan KAZCentral Asia | 68.131 | 10.262 | 21.6069 |
| 62 |  Ghana GHAWestern Africa | 67.961 | 22.871 | 9.1677 |
| 63 |  Belize BLZCentral America | 67.723 | 11.287 | 20.9901 |
| 64 |  Rwanda RWAEastern Africa | 67.722 | 24.203 | 8.0748 |
| 65 |  Barbados BRBCaribbean | 67.654 | 24.691 | 7.6543 |
| 66 |  Cabo Verde CPVWestern Africa | 67.252 | 31.100 | 1.6474 |
| 67 |  China CHNEastern Asia | 67.129 | 11.153 | 21.7177 |
| 68 |  Niger NERWestern Africa | 67.059 | 29.646 | 3.2950 |
| 69 |  Georgia GEOWestern Asia | 66.822 | 18.394 | 14.7835 |
| 70 |  Japan JPNEastern Asia | 66.214 | 19.232 | 14.5540 |
| 71 |  Armenia ARMWestern Asia | 65.767 | 29.814 | 4.4191 |
| 72 |  Qatar QATWestern Asia | 65.209 | 31.531 | 3.2604 |
| 73 |  Jordan JORWestern Asia | 64.384 | 31.009 | 4.6077 |
| 74 |  Spain ESPSouthern Europe | 64.116 | 15.161 | 20.7235 |
| 75 |  Lebanon LBNWestern Asia | 62.437 | 29.806 | 7.7569 |
| 76 |  Jamaica JAMCaribbean | 61.848 | 29.709 | 8.4431 |
| 77 |  New Zealand NZLAustralia and New Zealand | 61.655 | 24.573 | 13.7726 |
| 78 |  South Africa ZAFSouthern Africa | 61.484 | 29.884 | 8.6319 |
| 79 |  El Salvador SLVCentral America | 61.480 | 24.929 | 13.5909 |
| 80 |  Colombia COLSouth America | 60.423 | 30.096 | 9.4815 |
| 81 |  Fiji FJIMelanesia | 60.255 | 28.754 | 10.9906 |
| 82 |  Algeria DZANorthern Africa | 60.015 | 31.969 | 8.0163 |
| 83 |  Guatemala GTMCentral America | 59.645 | 21.669 | 18.6851 |
| 84 |  Venezuela VENSouth America | 58.390 | 36.030 | 5.5795 |
| 85 |  Brazil BRASouth America | 57.038 | 25.247 | 17.7144 |
| 86 |  Israel ISRWestern Asia | 55.762 | 37.575 | 6.6630 |
| 87 |  Burkina Faso BFAWestern Africa | 55.603 | 41.974 | 2.4239 |
| 88 |  South Korea KOREastern Asia | 55.207 | 29.534 | 15.2591 |
| 89 |  Kuwait KWTWestern Asia | 53.866 | 43.857 | 2.2777 |
| 90 |  Guinea GINWestern Africa | 53.651 | 37.077 | 9.2718 |
| 91 |  Albania ALBSouthern Europe | 52.864 | 33.357 | 13.7789 |
| 92 |  Cuba CUBCaribbean | 52.428 | 33.038 | 14.5334 |
| 93 |  Palestine PSEWestern Asia | 51.402 | 42.460 | 6.1381 |
| 94 |  Saint Vincent and the Grenadines VCTCaribbean | 51.292 | — | — |
| 95 |  Nigeria NGAWestern Africa | 50.956 | 33.152 | 15.8917 |
| 96 |  Comoros COMEastern Africa | 47.000 | 48.000 | 5.0000 |
| 97 |  Bahrain BHRWestern Asia | 46.021 | 48.465 | 5.5145 |
| 98 |  Malaysia MYSSouth-eastern Asia | 45.645 | 24.453 | 29.9016 |
| 99 |  Togo TGOWestern Africa | 44.970 | 52.663 | 2.3669 |
| 100 |  Mongolia MNGEastern Asia | 44.492 | 18.594 | 36.9142 |
| 101 |  North Macedonia MKDSouthern Europe | 44.441 | 33.497 | 22.0625 |
| 102 |  Italy ITASouthern Europe | 42.829 | 21.507 | 35.6641 |
| 103 |  Benin BENWestern Africa | 42.533 | 35.839 | 21.6272 |
| 104 |  Iceland ISLNorthern Europe | 42.424 | 49.091 | 8.4848 |
| 105 |  Gambia GMBWestern Africa | 41.289 | 38.782 | 19.9284 |
| 106 |  Côte d’Ivoire CIVWestern Africa | 40.828 | 39.447 | 19.7248 |
| 107 |  Botswana BWASouthern Africa | 39.872 | 41.668 | 18.4606 |
| 108 |  Malta MLTSouthern Europe | 35.037 | 63.771 | 1.1917 |
| 109 |  United States USANorthern America | 34.726 | 11.520 | 53.7538 |
| 110 |  Uganda UGAEastern Africa | 33.190 | 54.087 | 12.7230 |
| 111 |  Norway NORNorthern Europe | 31.635 | 31.635 | 36.7302 |
| 112 |  Gabon GABMiddle Africa | 31.529 | 58.708 | 9.7637 |
| 113 |  Ukraine UKREastern Europe | 30.002 | 19.490 | 50.5082 |
| 114 |  Angola AGOMiddle Africa | 27.704 | 41.313 | 30.9832 |
| 115 |  Denmark DNKNorthern Europe | 24.734 | 65.998 | 9.2679 |
| 116 |  Belarus BLREastern Europe | 24.028 | 46.593 | 29.3791 |
| 117 |  Sierra Leone SLEWestern Africa | 23.055 | 51.307 | 25.6382 |
| 118 |  Latvia LVANorthern Europe | 20.757 | — | — |
| 119 |  Russia RUSEastern Europe | 19.940 | 20.242 | 59.8187 |
| 120 |  Antigua and Barbuda ATGCaribbean | 16.839 | 62.694 | 21.2435 |
| 121 |  Djibouti DJIEastern Africa | 15.789 | 84.211 | 0.0000 |
| 122 |  Moldova MDAEastern Europe | 13.928 | 12.219 | 73.8533 |
| 123 |  Ireland IRLNorthern Europe | 13.843 | 61.384 | 24.7733 |
| 124 |  France FRAWestern Europe | 13.257 | 18.432 | 68.3103 |
| 125 |  Romania ROUEastern Europe | 12.926 | 20.169 | 66.9052 |
| 126 |  Hungary HUNEastern Europe | 11.882 | 14.530 | 73.5878 |
| 127 |  DR Congo CODMiddle Africa | 11.524 | 67.245 | 21.2310 |
| 128 |  Bulgaria BGREastern Europe | 11.276 | 16.239 | 72.4844 |
| 129 |  United Kingdom GBRNorthern Europe | 9.388 | 52.483 | 38.1281 |
| 130 |  Liberia LBRWestern Africa | 8.989 | 54.619 | 36.3929 |
| 131 |  Republic of the Congo COGMiddle Africa | 8.696 | 69.565 | 21.7391 |
| 132 |  Lesotho LSOSouthern Africa | 8.676 | 45.662 | 45.6621 |
| 133 |  Canada CANNorthern America | 7.683 | 13.786 | 78.5312 |
| 134 |  Seychelles SYCEastern Africa | 7.334 | 72.798 | 21.7307 |
| 135 |  Brunei BRNSouth-eastern Asia | 5.761 | — | — |
| 136 |  Equatorial Guinea GNQMiddle Africa | 5.447 | 79.521 | 15.0327 |
| 137 |  Slovakia SVKEastern Europe | 5.117 | 38.003 | 56.8805 |
| 138 |  Sweden SWENorthern Europe | 5.045 | 38.789 | 56.1659 |
| 139 |  Trinidad and Tobago TTOCaribbean | 4.963 | 62.623 | 32.4142 |
| 140 |  Austria AUTWestern Europe | 2.794 | 18.116 | 79.0907 |
| 141 |  Switzerland CHEWestern Europe | 2.714 | 42.454 | — |
| 142 |  Puerto Rico PRICaribbean | 2.702 | 19.717 | 77.5803 |
| 143 |  Lithuania LTUNorthern Europe | 2.644 | 6.391 | 90.9651 |
| 144 |  Finland FINNorthern Europe | 2.167 | 17.508 | 80.3257 |
| 145 |  Germany DEUWestern Europe | 1.630 | 25.273 | 73.0971 |
| 146 |  Croatia HRVSouthern Europe | 1.029 | 88.021 | 10.9503 |
| 147 |  Singapore SGPSouth-eastern Asia | 0.990 | 46.418 | 52.5920 |
| 148 |  Slovenia SVNSouthern Europe | 0.734 | 20.807 | 78.4586 |
| 149 |  Central African Republic CAFMiddle Africa | 0.582 | 82.829 | 16.5891 |
| 150 |  Belgium BELWestern Europe | 0.567 | 10.920 | 88.5129 |
| 151 |  Netherlands NLDWestern Europe | 0.550 | 13.496 | 85.9538 |
| 152 |  Papua New Guinea PNGMelanesia | 0.313 | 56.963 | 42.7240 |
| 153 |  Luxembourg LUXWestern Europe | 0.306 | 80.002 | 19.6918 |
| =154 |  Maldives MDVSouthern Asia | 0.000 | 96.414 | 3.5857 |
| =154 |  Monaco MCOWestern Europe | 0.000 | 100.000 | 0.0000 |
02In 2002
At either end
The 5 countries at each end of the headline, then the highest and lowest on each other measure.
Highest
- 1Somalia99.555
- 2Afghanistan98.431
- 3Mali98.114
- 4Nepal97.731
- 5Madagascar96.980
Lowest
- 154Maldivesshared0.000
- 154Monacoshared0.000
- 153Luxembourg0.306
- 152Papua New Guinea0.313
- 151Netherlands0.550
Neither end is better. The values describe a shape, not a score. The middle country reads 61.484. “Shared” marks a value another country also holds.
Each measure’s ends
032001 → 2002
Since 2001
What changed between 2001 and this one: who joined or left, and how far the headline moved.
- +4 / −4countries joined / left
- 139values changed, of 151 in both
- 38 · 101rose · fell
- 12unchanged
Rose most
- Eritrea77.928 → 84.388+6.460
- Venezuela52.405 → 58.390+5.985
- Latvia16.679 → 20.757+4.078
- Kenya69.303 → 72.743+3.439
- El Salvador58.662 → 61.480+2.818
Fell most
- Cabo Verde91.398 → 67.252−24.146
- Morocco80.443 → 74.582−5.862
- Saint Vincent and the Grenadines55.465 → 51.292−4.173
- North Macedonia48.140 → 44.441−3.699
- Suriname89.037 → 85.439−3.598
+ Ethiopia+ Croatia+ Palestine+ Slovenia − Czechia
 − Estonia
 − Greece
 − Poland
Both years come from the same release, so a difference here is a change in the data, not a revision of it. Every country’s full history is charted on the statistic page.
04Caveats
Read before you use
What this edition’s numbers are and are not, worked out from the file itself.
One year of the 2026 release
Every year in this series comes from FAO’s 2026 release, recalculated on one method. It can differ from what was first published for 2002.
154 distinct values among 155
Values are stored exactly as published, to 10 decimals. 2 countries share 0.000. Countries sharing a value share a position too.
The position is ours
FAO publishes values only; the order is this site’s.
7 empty cells
An empty cell means the publisher gave no figure. It is never a zero.
05The files
Download and cite
The table as a file, digit for digit, what this site changed, and a citation for this edition.
- .csv
For a spreadsheet or code
155 rows · 8.9 KB · UTF-8, opens in Excel
Opens with 11 lines of source notes; the table starts on row 13.
Download water-withdrawal-2002-nations-inquiry.csv - ↗
The publisher’s original
FAO’s own file, on its own site.
ER.H2O.FWAG.ZS
What this site changed: Reshaped into one row per country: regional and income-group totals are left out, only the columns listed are kept, each row gets its ISO 3166 code, and some country names are brought to one spelling. No value is recalculated, rescaled or rounded.
Licence: CC BY 4.0 · what it allows, in plain words
Cite this edition
Food and Agriculture Organization of the United Nations (FAO) (2002). Water Withdrawal by Sector, 2002 [data set], describing 2002. As held by Nations Inquiry, https://nationsinquiry.com/datasets/water-withdrawal/2002
0633 held
Other years
‹ The year before
Water Withdrawal by Sector, 2001155 countries
The year after ›
Water Withdrawal by Sector, 2003159 countries
All of them
Water Withdrawal by Sector: every year33 held, with the data dictionary, coverage and licence.
How it has moved, charted by country
07Questions
Water Withdrawal by Sector, 2002: questions and answers
Which country has the highest farming’s share of water use in Water Withdrawal by Sector, 2002?
Somalia, at 99.555, of the 155 countries in the file.
What year does Water Withdrawal by Sector, 2002 describe?
2002.
How many countries does Water Withdrawal by Sector, 2002 cover?
155.
Where can I download Water Withdrawal by Sector, 2002?
On this page, as a CSV file holding every value exactly as published, or from the publisher’s own site, linked below.
Is Water Withdrawal by Sector, 2002 the newest?
No. The newest held here is Water Withdrawal by Sector, 2022.