
Photo: Matt Kieffer · CC BY-SA 2.0 · via Wikimedia Commons, shown in greyscale
Topic 11 of 18 · Country Index 2026
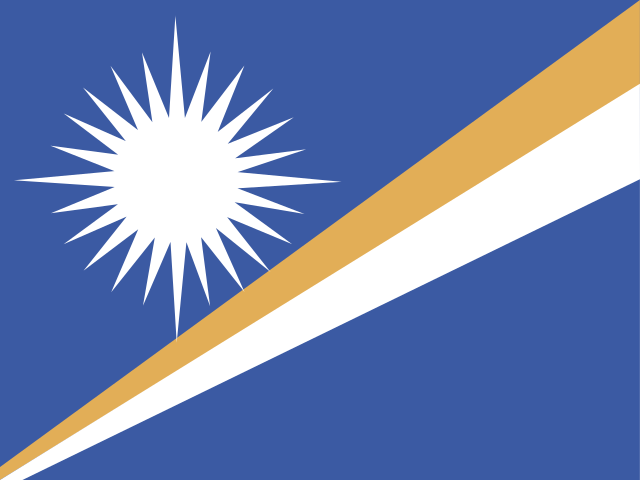
Marshall Islands: Risk & Resilience
How exposed is a country to crisis, and how ready is it to cope?
Marshall Islands is placed 89th of 193 countries on risk & resilience in the Country Index 2026, from 3 of its 4 key statistics. Readings behind it: World Risk Index 2.52 (2025); INFORM Risk Index 3.5 (2025).
Share
Risk & Resilience
89th
of 193 countries placed
Placed from 3 of 4 key statistics
Not placed in the Country Index 2026 overall: measured on too few topics.
- 2.52World Risk Index, 2025WorldRiskIndex score (0–100, where 100 is the most at risk)
- 3.5INFORM Risk Index, 2025INFORM Risk score (0–10, where 10 is the highest risk)
- 0.499Climate Vulnerability (ND-GAIN), 2024ND-GAIN Vulnerability (0–1, where 1 is the most vulnerable)
- —Able to Raise Emergency Funds Within 30 Days, 2024No reading for this country
01The evidence
The 4 key statistics that decide it
Only these place Marshall Islands on risk & resilience — one vote each. Every value is the publisher’s own, read at the edition the Country Index 2026 used — or, for a survey-based key, each country’s latest reading; the grey ticks are every other country it was compared with, lowest on the left.
Key 1 of 4
World Risk Index
Institute for International Law of Peace and Armed Conflict (IFHV), Ruhr University Bochum
2025 edition · data for 2025 · CC BY 4.0
2.52
WorldRiskIndex score (0–100, where 100 is the most at risk)
Lower is better
Marshall Islands: 2.52. Across the 193 countries in this edition, values run from 0.18 (Monaco) to 46.56 (Philippines); the world median is 4.17.
- World median
- 4.17
- Best in Micronesia
- 0.88 Nauru
Key 2 of 4
INFORM Risk Index
European Commission Joint Research Centre, with the Inter-Agency Standing Committee
2026 edition · data for 2025 · CC BY 4.0 (via the European Commission's reuse policy)
3.5
INFORM Risk score (0–10, where 10 is the highest risk)
Lower is better
Marshall Islands: 3.5. Across the 191 countries in this edition, values run from 0.7 (Singapore) to 8.5 (South Sudan); the world median is 3.7.
- World median
- 3.7
- Best in Micronesia
- 2.1 Nauru and Palau
Key 3 of 4
Climate Vulnerability (ND-GAIN)
Notre Dame Global Adaptation Initiative (ND-GAIN), University of Notre Dame
2024 edition · data for 2024 · CC BY 3.0 Unported
0.499
ND-GAIN Vulnerability (0–1, where 1 is the most vulnerable)
Lower is better
Ranked 136th of 190 by Notre Dame Global Adaptation Initiative (ND-GAIN), University of Notre Dame
Marshall Islands: 0.499. Across the 190 countries in this edition, values run from 0.263 (Norway) to 0.655 (Mauritania); the world median is 0.45.
- World median
- 0.45
- Best in Micronesia
- 0.482 Palau
Key 4 of 4
Able to Raise Emergency Funds Within 30 Days
World Bank Group
Latest reading per country, 2021–2024 · CC BY 4.0
No reading
Adults who could raise emergency funds within 30 days without great difficulty (% of population aged 15+)
Higher is better
World Bank Group publishes no reading from 2021–2024 for Marshall Islands, so the standing rests on the other keys.
Across the 142 countries at their latest reading, values run from 16.49 (South Sudan) to 93.69 (Sweden); the world median is 53.85.
- World median
- 53.85
02Over time
Which way Marshall Islands is moving
Each key’s published value, edition by edition, beside the world median. The Country Index 2026 is the first edition of the standing, so the standing itself has no history to chart yet.
World Risk Index
WorldRiskIndex score (0–100, where 100 is the most at risk) · lower is better
Marshall IslandsWorld median
Marshall Islands fell from 2.62 in 2000 to 2.52 in 2025; the world median went from 4.55 to 4.17.
Every year’s figures
Year Marshall Islands World median 2025 2.52 4.17 2024 2.52 4.17 2023 2.26 4.27 2022 2.41 4.08 2021 2.31 4.23 2020 2.29 4.12 2019 2.02 4.23 2018 2.87 4.14 2017 2.31 4.24 2016 2.92 4.23 2015 2.93 4.04 2014 3.21 4.07 2013 2.35 4.08 2012 2.95 4.07 2011 2.94 3.99 2010 2.86 3.86 2009 2.63 3.94 2008 3.19 4.11 2007 2.53 4.41 2006 2.56 4.51 2005 2.57 4.54 2004 2.54 4.42 2003 2.52 4.50 2002 2.53 4.65 2001 2.60 4.37 2000 2.62 4.55 INFORM Risk Index
INFORM Risk score (0–10, where 10 is the highest risk) · lower is better
Marshall IslandsWorld median
Marshall Islands fell from 3.6 in 2016 to 3.5 in 2025; the world median went from 3.6 to 3.7.
Every year’s figures
Year Marshall Islands World median 2025 3.5 3.7 2024 3.5 3.5 2023 3.4 3.6 2022 3.4 3.6 2021 3.1 3.6 2020 3.1 3.6 2019 3.1 3.6 2018 3.2 3.5 2017 3.5 3.5 2016 3.6 3.6 Climate Vulnerability (ND-GAIN)
ND-GAIN Vulnerability (0–1, where 1 is the most vulnerable) · lower is better
Marshall IslandsWorld median
Marshall Islands fell from 0.54 in 2000 to 0.499 in 2024; the world median went from 0.476 to 0.45.
Every year’s figures
Year Marshall Islands World median 2024 0.4989 0.449649 2023 0.4988 0.449167 2022 0.5094 0.447422 2021 0.5088 0.447831 2020 0.5097 0.447902 2019 0.5107 0.447883 2018 0.5118 0.449652 2017 0.5145 0.450532 2016 0.5159 0.451843 2015 0.5171 0.451496 2014 0.5183 0.451502 2013 0.5195 0.454946 2012 0.5205 0.454269 2011 0.5207 0.458012 2010 0.5232 0.460715 2009 0.5258 0.464712 2008 0.5265 0.463801 2007 0.5314 0.466738 2006 0.5296 0.468701 2005 0.5308 0.470646 2004 0.5324 0.472029 2003 0.5342 0.471635 2002 0.5361 0.472031 2001 0.5381 0.476366 2000 0.5402 0.475585
03In context
Marshall Islands beside its neighbours
A position reads best beside the countries around it. Every position below is a place among all 193 countries on risk & resilience, never a place within the region.
Marshall Islands and Micronesia
Marshall Islands has no land border, so the table compares it with its sub-region. Standing among all 193; the key columns are the publishers’ own values.
| Country | Standing | World Risk IndexWorldRiskIndex score (0–100, where 100 is the most at risk) | INFORM Risk IndexINFORM Risk score (0–10, where 10 is the highest risk) | Climate Vulnerability (ND-GAIN)ND-GAIN Vulnerability (0–1, where 1 is the most vulnerable) | Able to Raise Emergency Funds Within 30 DaysAdults who could raise emergency funds within 30 days without great difficulty (% of population aged 15+) |
|---|---|---|---|---|---|
 Nauru | 43rd | 0.88 | 2.1 | 0.502 | — |
 Palau | =52nd | 2.17 | 2.1 | 0.482 | — |
| Marshall Islands | 89th | 2.52 | 3.5 | 0.499 | — |
 Kiribati | 101st | 2.8 | 3.6 | 0.528 | — |
 Micronesia | 128th | 4.17 | 3.3 | 0.621 | — |
 Guam | not placed | — | — | — | — |
 Northern Mariana Islands | not placed | — | — | — | — |
“—”: no published reading in that edition. What a standing is
Across Micronesia
Every country in the sub-region, by its place among all 193.
Placed either side on risk & resilience
The countries immediately above and below Marshall Islands in the topic’s list.
 Russia86th
 Ukraine87th
 Chile88th
- Marshall Islands89th
 Tunisia90th
 Suriname91st
 Bolivia92nd
04Context, no vote
Where Marshall Islands is ahead of the world, and behind
7 more statistics filed under risk & resilience, published in full and deliberately given no vote in the standing. Select a row for the publisher, the rank and the links.
Ahead of the world median3
Statistics on which Marshall Islands does better than the middle country measured.
Political Stability and Absence of ViolenceWorld Bank Group · 2025 · world median 0.1711.5180.171▲ Improved since 2015
Marshall Islands: 1.518 · world median 0.171 · Political Stability estimate (−2.5 to 2.5). World Bank Group, 2025 edition, data for 2025.
Published values in that edition run from -2.506 to 1.563; higher is better.
Position 3rd of 211 · derived.
Days Above 35°CECMWF · 2025 · world median 3.4803.48No real change since 2015
Marshall Islands: 0 · world median 3.48 · Days a year with a maximum temperature above 35°C, averaged over the country’s land. World Bank Group (Climate Change Knowledge Portal), from Copernicus ERA5 (ECMWF), 2025 edition, data for 2025.
Published values in that edition run from 0 to 222.89; lower is better.
Climate Readiness (ND-GAIN)Notre Dame Global Adaptation Initiative (ND-GAIN), University of Notre Dame · 2024 · world median 0.3870.420.387▲ Improved since 2014
Marshall Islands: 0.42 · world median 0.387 · ND-GAIN Readiness (0–1, where 1 is the most ready). Notre Dame Global Adaptation Initiative (ND-GAIN), University of Notre Dame, 2024 edition, data for 2024.
Published values in that edition run from 0.137 to 0.749; higher is better.
Ranked 82nd of 192 by Notre Dame Global Adaptation Initiative (ND-GAIN), University of Notre Dame.
Behind the world median1
Statistics on which Marshall Islands does worse than the middle country measured.
ND-GAIN Country IndexNotre Dame Global Adaptation Initiative (ND-GAIN), University of Notre Dame · 2024 · world median 47.4446.0547.44▲ Improved since 2014
Marshall Islands: 46.05 · world median 47.44 · ND-GAIN Index (0–100, where 100 is best placed to adapt). Notre Dame Global Adaptation Initiative (ND-GAIN), University of Notre Dame, 2024 edition, data for 2024.
Published values in that edition run from 26.42 to 71.85; higher is better.
Ranked 102nd of 190 by Notre Dame Global Adaptation Initiative (ND-GAIN), University of Notre Dame.
No better end3
These describe the shape of a country — more is not better or worse, only different — so they are never ahead or behind.
Population Living Below 5 m ElevationCenter for International Earth Science Information Network (CIESIN), Columbia University · 2015 · world median 2.95467.972.954No real change since 1990
Marshall Islands: 67.97 · world median 2.954 · Population living below 5 m elevation (% of total population). Center for International Earth Science Information Network (CIESIN), Columbia University, 2015 edition, data for 2015.
Published values in that edition run from 0 to 78.48.
Refugees by Country of OriginUNHCR, the UN Refugee Agency · 2025 · world median 1,27201,272Moved since 2015
Marshall Islands: 0 · world median 1,272 · Refugees under UNHCR's mandate from this country, end of year (people). UNHCR, the UN Refugee Agency, 2025 edition, data for 2025.
Published values in that edition run from 0 to 5,224,131.
Temperature Change on LandFAO · 2025 · world median 1.4740.5071.474Moved since 2015
Marshall Islands: 0.507 · world median 1.474 · Change in mean land-surface temperature against the country's own 1951–1980 average, °C. Food and Agriculture Organization of the United Nations (FAO), 2025 edition, data for 2025.
Published values in that edition run from 0.34 to 3.294.
No current reading for Marshall Islands
Able to Raise Emergency Funds Within 30 Days, Adults Who Experienced a Natural Disaster or Severe Weather, Asylum-Seekers by Country of Asylum, Baseline Water Stress (Aqueduct), Burned Area, Children's Climate Risk Index, Drought Risk (Aqueduct), Firms Whose Assets Were Damaged by Extreme Weather, Global Report on Food Crises, INFORM Severity Index, Internally Displaced People of Concern to UNHCR, Per Capita Food Supply Variability, Refugee Population by Country of Asylum, Renewable Internal Freshwater Resources per Capita, Riverine Flood Risk (Aqueduct), Stateless Persons by Country of Residence, Water Stress and World Risk Poll Resilience Index. Listed rather than hidden, so the page can be checked against it.
“Position · derived” is this site’s ordering of the published values, 1st = best unless the row says otherwise; the publisher ranks no country on it. Rank, position and standing
05Country Index 2026
Risk & Resilience among Marshall Islands’s 8 topics
Risk & Resilience is Marshall Islands’s 4th best-placed topic of 8. Strongest first, each marker at its share of that topic’s field.
- Democracy & Civil Liberties24th of 1982/4 keys
- Education & Knowledge57th of 1982/4 keys
- Poverty & Inequality72nd of 1592/3 keys
- Risk & Resilience89th of 1933/4 keys
- Development & Human Capital134th of 1963/3 keys
- Health & Wellbeing162nd of 2003/4 keys
- Governance & Institutions167th of 1942/4 keys
- Digital & Technology196th of 1982/4 keys
No standing on Economy & Innovation, Work & Labour, Environment & Sustainability, Gender & Equality, Peace & Security, Mobility & Trade, Food & Agriculture, Energy: too few of those topics’ key statistics are published for this country.
06The top of the list
Who leads on risk & resilience
The three countries placed highest of 193, and the leaders Marshall Islands can most readily be measured against.
 1
 Liechtenstein
Western Europe
1st of 193 · 2 of 4 keys
Photo: Guido Radig,Inkey · CC BY 3.0, greyscale
 2
 Luxembourg
Western Europe
2nd of 193 · 3 of 4 keys
Photo: Michal Osmenda from Brussels, Belgium · CC BY-SA 2.0, greyscale
 3
 Denmark
Northern Europe
3rd of 193 · 4 of 4 keys
Photo: User:Aconcagua · CC BY-SA 3.0, greyscale
Placed highest nearby
Highest in Oceania
 New Zealand26th4/4 keys
Highest in Micronesia
Nauru43rd3/4 keysThis page
Marshall Islands89th3/4 keys
Positions out of 193 placed on the topic. A country needs readings on enough keys to be placed, and the top of the list is often held on fewer of them.
07Questions
Marshall Islands on risk & resilience: questions answered
Every answer is built from the numbers on this page, so none can say something the page does not.
How does Marshall Islands rank on risk & resilience?
Marshall Islands is placed 89th of 193 countries on Risk & Resilience in the Country Index 2026, from 3 of its 4 key statistics (World Risk Index, INFORM Risk Index and Climate Vulnerability (ND-GAIN)). The position is this site’s ordering of published statistics, not a rank any publisher printed.
What is the latest World Risk Index figure for Marshall Islands?
2.52 in 2025 (worldRiskIndex score (0–100, where 100 is the most at risk)), according to Institute for International Law of Peace and Armed Conflict (IFHV), Ruhr University Bochum. The world median in the same edition was 4.17.
What is the latest INFORM Risk Index figure for Marshall Islands?
3.5 in 2025 (iNFORM Risk score (0–10, where 10 is the highest risk)), according to European Commission Joint Research Centre, with the Inter-Agency Standing Committee. The world median in the same edition was 3.7.
How have Marshall Islands’s risk & resilience figures changed?
World Risk Index fell from 2.62 in 2000 to 2.52 in 2025; INFORM Risk Index fell from 3.6 in 2016 to 3.5 in 2025; Climate Vulnerability (ND-GAIN) fell from 0.54 in 2000 to 0.499 in 2024.
Which risk & resilience statistics are missing for Marshall Islands?
No current reading is published for Marshall Islands on Able to Raise Emergency Funds Within 30 Days, Adults Who Experienced a Natural Disaster or Severe Weather, Asylum-Seekers by Country of Asylum, Baseline Water Stress (Aqueduct), Burned Area, Children's Climate Risk Index, Drought Risk (Aqueduct), Firms Whose Assets Were Damaged by Extreme Weather, Global Report on Food Crises, INFORM Severity Index, Internally Displaced People of Concern to UNHCR, Per Capita Food Supply Variability, Refugee Population by Country of Asylum, Renewable Internal Freshwater Resources per Capita, Riverine Flood Risk (Aqueduct), Stateless Persons by Country of Residence, Water Stress and World Risk Poll Resilience Index. They are listed rather than hidden, so the evidence on the page can be checked against it.
08Method
Method, sources and how to cite
What this topic does not measure
This topic does not forecast when a disaster will strike, and it does not measure financial or economic risk. Water stress is measured under Environment & Sustainability. Displacement caused by disasters and the severity of crises already under way are published here as context.
How the Risk & Resilience standing is decided
A standing is this site’s ordering, named with its edition — never a publisher’s rank. 4 key statistics vote, one vote each; every country’s published value becomes a place within that key’s own field, the places are averaged, and the average is never published. A country needs 2 of the 4 keys to be placed.
The risk & resilience method, step by stepHow every standing on this site is built
The key statistics and their licences
- World Risk Index — Institute for International Law of Peace and Armed Conflict (IFHV), Ruhr University Bochum, CC BY 4.0
- INFORM Risk Index — European Commission Joint Research Centre, with the Inter-Agency Standing Committee, CC BY 4.0 (via the European Commission's reuse policy)
- Climate Vulnerability (ND-GAIN) — Notre Dame Global Adaptation Initiative (ND-GAIN), University of Notre Dame, CC BY 3.0 Unported
- Able to Raise Emergency Funds Within 30 Days — World Bank Group, CC BY 4.0
The other 7 statistics on this page come from 6 publishers, each named beside its numbers, with every edition and licence on the datasets pages.
The standing itself is part of the Country Index 2026, published under CC BY-SA 4.0.
Photographs
Marshall Islands’s banner and the countries placed highest, from their profiles: Wikimedia Commons, shown in greyscale, each used under the licence named.
- Marshall Islands (banner) — Matt Kieffer, CC BY-SA 2.0
- Liechtenstein — Guido Radig,Inkey, CC BY 3.0
- Luxembourg — Michal Osmenda from Brussels, Belgium, CC BY-SA 2.0
- Denmark — User:Aconcagua, CC BY-SA 3.0
Cite this page
Nations Inquiry (2026). Marshall Islands: Risk & Resilience — standing and statistics, Country Index 2026. https://nationsinquiry.com/countries/marshall-islands/risk