
Photo: Woodlouse derivative work: Jjtkk · CC BY-SA 2.0 · via Wikimedia Commons, shown in greyscale
Topic 12 of 18 · Country Index 2026

Comoros: Mobility & Trade
How connected is a country to the rest of the world?
Comoros is placed joint 172nd of 177 countries on mobility & trade in the Country Index 2026, from 2 of its 4 key statistics. Readings behind it: Liner Shipping Connectivity Index 15.67 (2025); Container Import Dwell Time 9 (2024).
Mobility & Trade
joint172nd
of 177 countries placed
Placed from 2 of 4 key statistics
01The evidence
The 4 key statistics that decide it
Only these place Comoros on mobility & trade — one vote each. Every value is the publisher’s own, read at the edition the Country Index 2026 used; the grey ticks are every other country it was compared with, lowest on the left.
Key 1 of 4
Liner Shipping Connectivity Index
UN Trade and Development (UNCTAD)
Why it is a key: How much of the world's container shipping actually calls at a country's ports — the infrastructure side of connectedness, where logistics performance is the paperwork side.
2025 edition · data for 2025 · CC BY 3.0 IGO
15.67
LSCI (index, average Q1 2023 = 100)
Higher is better
Ranked 151st of 177 by UNCTAD
Comoros: 15.67. Across the 168 countries in this edition, values run from 4.13 (Turks and Caicos Islands) to 1,313 (China); the world median is 60.84.
- World median
- 60.84
- Best in Eastern Africa
- 83.05 Kenya
Each grey tick is one of 168 countries in the 2025 edition.
Key 2 of 4
Container Import Dwell Time
World Bank Group
Why it is a key: How long an imported container waits in port before it moves on — a measured, not surveyed, reading of how efficiently ports, customs and carriers let goods cross a border.
2024 edition · data for 2024 · CC BY 4.0
9
Median days a full import container waits in port
Lower is better
Comoros: 9. Across the 156 countries in this edition, values run from 1 (Gibraltar) to 21.6 (Haiti); the world median is 4.4.
- World median
- 4.4
- Best in Eastern Africa
- 2.8 Kenya
Each grey tick is one of 156 countries in the 2024 edition.
Key 3 of 4
Logistics Performance Index
World Bank Group
Why it is a key: How efficiently goods actually cross a country's borders, ports and customs.
2023 edition · data for 2023 · CC BY 4.0
No reading
LPI score (1–5)
Higher is better
World Bank Group publishes no 2023 figure for Comoros, so the standing rests on the other keys.
Across the 139 countries in this edition, values run from 1.9 (Afghanistan) to 4.3 (Singapore); the world median is 2.9.
- World median
- 2.9
- Best in Eastern Africa
- 2.8 Rwanda
Each grey tick is one of 139 countries in the 2023 edition.
Key 4 of 4
ICT Goods Exports
UN Trade and Development (UNCTAD)
Why it is a key: How far a country is plugged into global technology trade.
2024 edition · data for 2024 · CC BY 3.0 IGO
No reading
ICT goods exports (% of total goods exports)
Higher is better
UNCTAD publishes no 2024 figure for Comoros, so the standing rests on the other keys.
Across the 120 countries in this edition, values run from 0 (Gambia) to 61.45 (Hong Kong); the world median is 0.975.
- World median
- 0.975
- Best in Eastern Africa
- 1.26 Mauritius
Each grey tick is one of 120 countries in the 2024 edition.
02Over time
Which way Comoros is moving
Each key’s published value, edition by edition, beside the world median. The Country Index 2026 is the first edition of the standing, so the standing itself has no history to chart yet.
Liner Shipping Connectivity Index
LSCI (index, average Q1 2023 = 100) · higher is better
ComorosWorld median
Comoros rose from 13.24 in 2006 to 15.64 in 2026; the world median went from 52.25 to 56.21.
Every year’s figures
Year Comoros World median 2026 15.64 56.21 2025 15.67 60.84 2024 15.77 55.22 2023 16.52 54.78 2022 12.22 51.49 2021 13.96 52.64 2020 15.98 47.86 2019 18.86 51.05 2018 16.07 52.03 2017 15.47 49.87 2016 18.32 48.09 2015 20.39 49.13 2014 20.28 48.08 2013 18.46 51.32 2012 20.69 47.44 2011 20.67 50.26 2010 22.05 50.51 2009 15.27 53.04 2008 5.42 51.68 2007 12.99 55.78 2006 13.24 52.25 Logistics Performance Index
LPI score (1–5) · higher is better
ComorosWorld median
Comoros rose from 2.478 in 2007 to 2.557 in 2018; the world median went from 2.529 to 2.706.
Every year’s figures
Year Comoros World median 2023 — 2.900 2018 2.56 2.706 2016 2.58 2.734 2014 2.40 2.753 2012 2.14 2.773 2010 2.45 2.746 2007 2.48 2.529 ICT Goods Exports
ICT goods exports (% of total goods exports) · higher is better
ComorosWorld median
Comoros rose from 0.05 in 2000 to 0.09 in 2021; the world median went from 0.43 to 0.55.
Every year’s figures
Year Comoros World median 2024 — 0.975000 2023 — 0.690000 2022 — 0.565000 2021 0.09 0.550000 2020 0.07 0.680000 2019 0.51 0.625000 2018 0.06 0.480000 2017 5.24 0.630000 2016 0.06 0.865000 2015 0.04 0.790000 2014 0.17 0.760000 2013 0.06 0.645000 2012 0.07 0.630000 2011 0.04 0.535000 2010 0.09 0.560000 2009 0.87 0.780000 2008 0.55 0.595000 2007 — 0.660000 2006 0.13 0.445000 2005 0.02 0.570000 2004 0.04 0.535000 2003 0.15 0.530000 2002 0.01 0.510000 2001 0.06 0.490000 2000 0.05 0.430000
03In context
Comoros beside its neighbours
A position reads best beside the countries around it. Every position below is a place among all 177 countries on mobility & trade, never a place within the region.
Comoros and Eastern Africa
Comoros has no land border, so the table compares it with its sub-region. The standing is each country’s place among all 177 placed on the topic; the other columns are the publishers’ own values, read at the edition the standing used.
| Country | Standing | Liner Shipping Connectivity IndexLSCI (index, average Q1 2023 = 100) | Container Import Dwell TimeMedian days a full import container waits in port | Logistics Performance IndexLPI score (1–5) | ICT Goods ExportsICT goods exports (% of total goods exports) |
|---|---|---|---|---|---|
 Kenya Kenya | 44th | 83.05 | 2.8 | — | — |
 Mauritius Mauritius | 78th | 80.68 | 3.4 | 2.5 | 1.26 |
 Djibouti Djibouti | 125th | 77.23 | 10.5 | 2.7 | — |
 Mozambique Mozambique | =126th | 61.9 | 4.4 | — | 0.02 |
 Tanzania Tanzania | =139th | 69.73 | 8.8 | — | 0.1 |
 Madagascar Madagascar | 149th | 28.18 | 5.5 | 2.3 | — |
 Somalia Somalia | 159th | 39.57 | 7.1 | 2 | — |
 Zimbabwe Zimbabwe | 168th | — | — | 2.5 | 0.02 |
| Comoros | =172nd | 15.67 | 9 | — | — |
 Seychelles Seychelles | =172nd | 19.25 | 8.8 | — | 0.03 |
 Eritrea Eritrea | 177th | 5.548 | 14.8 | — | — |
 Burundi Burundi | not placed | — | — | — | — |
 Ethiopia Ethiopia | not placed | — | — | — | — |
 Malawi Malawi | not placed | — | — | — | 0.14 |
 Rwanda Rwanda | not placed | — | — | 2.8 | — |
| Somaliland | not placed | — | — | — | — |
 South Sudan South Sudan | not placed | — | — | — | — |
 Uganda Uganda | not placed | — | — | — | 0.07 |
 Zambia Zambia | not placed | — | — | — | 0.06 |
“—” means the publisher gives no reading for that country in that edition. A country needs readings on enough keys to be placed.
Across Eastern Africa
Every country in the sub-region, by its place among all 177.
Placed either side on mobility & trade
The countries immediately above and below Comoros in the topic’s list.





04Context, no vote
Where Comoros is ahead of the world, and behind
16 more statistics filed under mobility & trade, published in full and deliberately given no vote in the standing. Select a row for the publisher, the rank and the links.
Ahead of the world median1
Statistics on which Comoros does better than the middle country measured.
Cost of Sending RemittancesWorld Bank Group · 2023 · world median 3.2251.7433.225▼ Worsened since 2016
Comoros: 1.743 · world median 3.225 · Average cost of sending $200 home (% of the amount). World Bank Group, 2023 edition, data for 2023.
Published values in that edition run from -49.69 to 19.63; lower is better.
Position 81st of 93 — derived here by ordering the published values, 1st = worst. The publisher ranks no country on this.
Behind the world median3
Statistics on which Comoros does worse than the middle country measured.
Freedom of Foreign MovementV-Dem Institute, University of Gothenburg · 2025 · world median 1.20.4171.2▼ Worsened since 2015
Comoros: 0.417 · world median 1.2 · Original latent estimate (≈ −3.6 to +2.9); higher = freer movement. V-Dem Institute, University of Gothenburg, 2025 edition, data for 2025.
Published values in that edition run from -3.642 to 2.727; higher is better.
Position 126th of 176 — derived here by ordering the published values, 1st = best. The publisher ranks no country on this.
Digitally-Deliverable Services ExportsUNCTAD · 2024 · world median 25.4212.5525.42▼ Worsened since 2014
Comoros: 12.55 · world median 25.42 · Digitally-deliverable services exports (% of services exports). UN Trade and Development (UNCTAD), 2024 edition, data for 2024.
Published values in that edition run from 0.377 to 87.15; higher is better.
Position 123rd of 170 — derived here by ordering the published values, 1st = best. The publisher ranks no country on this.
Digital Services Trade Restrictiveness IndexOECD · 2025 · world median 0.2060.5190.206No real change since 2015
Comoros: 0.519 · world median 0.206 · Digital STRI (0 = open, 1 = closed). OECD, 2025 edition, data for 2025.
Published values in that edition run from 0.021 to 0.649; lower is better.
Position 7th of 125 — derived here by ordering the published values, 1st = worst. The publisher ranks no country on this.
No better end12
These describe the shape of a country — more is not better or worse, only different — so they are never ahead or behind.
Export Concentration IndexUNCTAD · 2025 · world median 0.3060.70.306Moved since 2015
Comoros: 0.7 · world median 0.306 · Export concentration index (0–1, normalised Herfindahl–Hirschman). UN Trade and Development (UNCTAD), 2025 edition, data for 2025.
Published values in that edition run from 0.059 to 0.933.
EmigrantsUN DESA Population Division · 2024 · world median 444,451367,574444,451Moved since 2015
Comoros: 367,574 · world median 444,451 · Migrants from the country living abroad, mid-year (people). UN DESA Population Division, 2024 edition, data for 2024.
Published values in that edition run from 313 to 18,533,845.
Services ExportsUNCTAD · 2025 · world median 9.6027.5939.602Moved since 2015
Comoros: 7.593 · world median 9.602 · Services exports (% of GDP). UN Trade and Development (UNCTAD), 2025 edition, data for 2025.
Published values in that edition run from 0.085 to 166.21.
Commodity Export DependenceUNCTAD · 2024 · world median 67.1750.5767.17Moved since 2014
Comoros: 50.57 · world median 67.17 · Commodity exports (% of merchandise exports, three-year average). UN Trade and Development (UNCTAD), 2024 edition, data for 2024.
Published values in that edition run from 4.605 to 99.77.
Imports of Goods and Services (% of GDP)World Bank Group · 2025 · world median 41.7231.5941.72Moved since 2015
Comoros: 31.59 · world median 41.72 · Imports of goods and services (% of GDP). World Bank Group, 2025 edition, data for 2025.
Published values in that edition run from 1.279 to 196.89.
Position 93rd of 138 — derived here by ordering the published values, counted from the highest value. The publisher ranks no country on this.
Net Migration RateUN DESA Population Division · 2023 · world median -0.133-2.354-0.133Moved since 2013
Comoros: -2.354 · world median -0.133 · Net migrants per 1,000 population. UN DESA Population Division, 2023 edition, data for 2023.
Published values in that edition run from -61.68 to 39.62.
International Migrants as a Share of PopulationUN DESA Population Division · 2024 · world median 6.0891.4366.089Moved since 2015
Comoros: 1.436 · world median 6.089 · International migrants (% of population). UN DESA Population Division, 2024 edition, data for 2024.
Published values in that edition run from 0.02 to 100.
Trade (% of GDP)World Bank Group · 2025 · world median 79.6840.8979.68Moved since 2015
Comoros: 40.89 · world median 79.68 · Exports plus imports (% of GDP). World Bank Group, 2025 edition, data for 2025.
Published values in that edition run from 2.382 to 396.65.
Position 117th of 138 — derived here by ordering the published values, counted from the highest value. The publisher ranks no country on this.
Asylum-Seekers by Country of AsylumUNHCR, the UN Refugee Agency · 2025 · world median 1,836141,836Moved since 2021
Comoros: 14 · world median 1,836 · Asylum-seekers awaiting a decision, end of year (people). UNHCR, the UN Refugee Agency, 2025 edition, data for 2025.
Published values in that edition run from 0 to 3,718,945.
International MigrantsUN DESA Population Division · 2024 · world median 223,32312,449223,323No real change since 2015
Comoros: 12,449 · world median 223,323 · International migrants living in the country, mid-year (people). UN DESA Population Division, 2024 edition, data for 2024.
Published values in that edition run from 246 to 52,375,047.
Refugee Population by Country of AsylumUNHCR, the UN Refugee Agency · 2025 · world median 12,269512,269Moved since 2021
Comoros: 5 · world median 12,269 · Refugees under UNHCR's mandate hosted, end of year (people). UNHCR, the UN Refugee Agency, 2025 edition, data for 2025.
Published values in that edition run from 0 to 2,655,191.
Exports of Goods and Services (% of GDP)World Bank Group · 2025 · world median 36.349.29836.34No real change since 2015
Comoros: 9.298 · world median 36.34 · Exports of goods and services (% of GDP). World Bank Group, 2025 edition, data for 2025.
Published values in that edition run from 1.103 to 199.76.
Position 135th of 138 — derived here by ordering the published values, counted from the highest value. The publisher ranks no country on this.
No current reading for Comoros
Average Time to Clear Exports Through Customs, Cereal Import Dependency Ratio (last 2017), Container Port Traffic (last 2019), Creative Goods Exports (last 2023), Creative Services Exports, Foreign Value Added Share of Gross Exports, ICT Goods Exports (last 2021), ICT Services Exports (last 2022), Inbound Mobility Rate, Tertiary (last 2017), Logistics Performance Index (last 2018), Merchant Fleet by Country of Ownership, Outbound Mobility Ratio, Tertiary (last 2014) and Tariff Rate, Applied, Weighted Mean, All Products (last 2021). Listed rather than hidden, so the page can be checked against it.
05Country Index 2026
Mobility & Trade among Comoros’s 15 topics
Mobility & Trade is Comoros’s 15th best-placed topic of 15. Strongest first; each marker sits at the position divided by that topic’s field, so fields of different sizes compare fairly.
- Environment & Sustainabilityjoint 8th of 1812/3 keys
- Risk & Resilience99th of 1934/4 keys
- Poverty & Inequality98th of 1593/3 keys
- Democracy & Civil Libertiesjoint 142nd of 1984/4 keys
- Work & Labour133rd of 1824/4 keys
- Economy & Innovation134th of 1763/4 keys
- Gender & Equality144th of 1834/4 keys
- Health & Wellbeing159th of 2004/4 keys
- Education & Knowledge165th of 1964/4 keys
- Development & Human Capitaljoint 168th of 1963/3 keys
- Peace & Security152nd of 1773/4 keys
- Food & Agriculture152nd of 1753/4 keys
- Digital & Technology176th of 1984/4 keys
- Governance & Institutions174th of 1944/4 keys
- Mobility & Tradejoint 172nd of 1772/4 keys
No standing on Energy: too few of those topics’ key statistics are published for this country.
06The top of the list
Who leads on mobility & trade
The three countries placed highest of 177, and the leaders Comoros can most readily be measured against.
 1
1 Singapore
South-eastern Asia
1st of 177 · 4 of 4 keys
Photo: Khairul Nizam . · CC BY 2.0, greyscale
 2
2 Macau
MacauEastern Asia
2nd of 177 · 2 of 4 keys
Photo: Diego Delso · CC BY-SA 3.0, greyscale
 3
3 Hong Kong
Eastern Asia
3rd of 177 · 4 of 4 keys
Photo: Base64 and Derivative work by Globe-trotter · CC BY-SA 3.0, greyscale
Placed highest nearby
Highest in Africa
 South Africa39th4/4 keys
Highest in Eastern Africa
Kenya44th2/4 keysThis page
Comoros=172nd2/4 keys
Positions out of 177 placed on the topic. A country needs readings on enough keys to be placed, and the top of the list is often held on fewer of them.
07Analysis
Charts and analysis about Comoros and mobility & trade
On mobility & trade
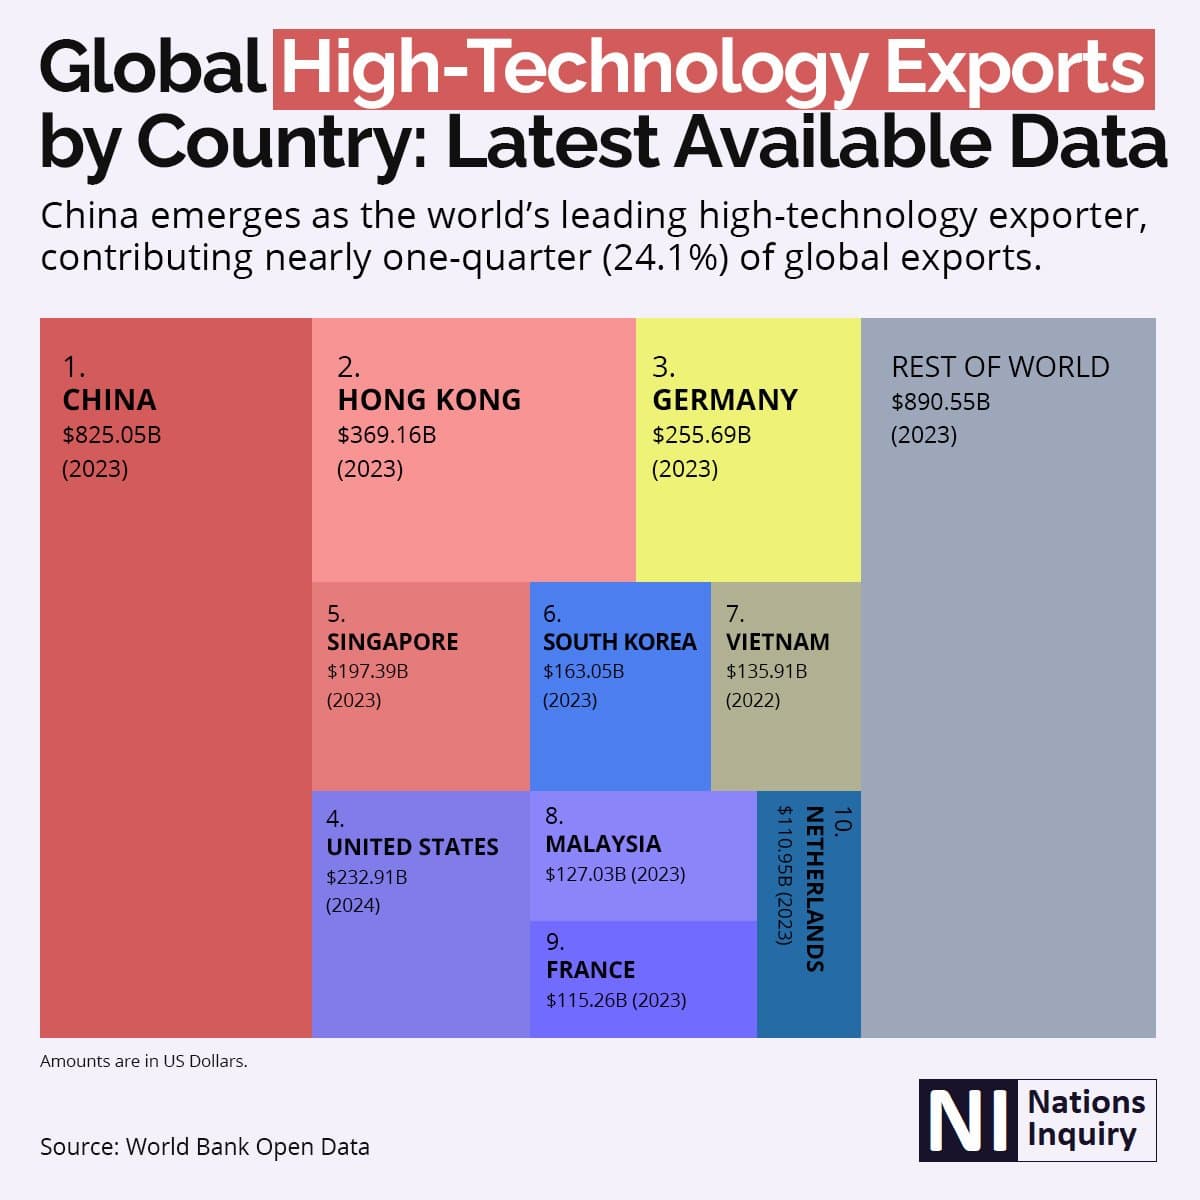
China Leads Global High-Technology Exports
The world’s ten largest high-technology exporters as a treemap, with the rest of the world beside them. Each country’s figure is its own most recent year, between 2022 and 2024.

On mobility & trade
The World’s Safest Airlines for 2025
The eleven safest airlines of 2025, each beside the country it is based in, and the nine things the grading looks at. Three airlines share third place, and the publisher gives an order but no score.

On mobility & trade
The world’s most powerful passports for 2025
Sixteen passports, their mobility scores, and the visa-free, visa-on-arrival and visa-required split behind each. Fourteen share third place while differing in how they reach it.
08Questions
Comoros on mobility & trade: questions answered
Every answer is built from the numbers on this page, so none can say something the page does not.
How does Comoros rank on mobility & trade?
Comoros is placed joint 172nd of 177 countries on Mobility & Trade in the Country Index 2026, from 2 of its 4 key statistics (Liner Shipping Connectivity Index and Container Import Dwell Time). The position is this site’s ordering of published statistics, not a rank any publisher printed.
What is the latest Liner Shipping Connectivity Index figure for Comoros?
15.67 in 2025 (lSCI (index, average Q1 2023 = 100)), according to UN Trade and Development (UNCTAD). The world median in the same edition was 60.84.
What is the latest Container Import Dwell Time figure for Comoros?
9 in 2024 (median days a full import container waits in port), according to World Bank Group. The world median in the same edition was 4.4.
How have Comoros’s mobility & trade figures changed?
Liner Shipping Connectivity Index rose from 13.24 in 2006 to 15.64 in 2026; Logistics Performance Index rose from 2.478 in 2007 to 2.557 in 2018; ICT Goods Exports rose from 0.05 in 2000 to 0.09 in 2021.
Which mobility & trade statistics are missing for Comoros?
No current reading is published for Comoros on Average Time to Clear Exports Through Customs, Cereal Import Dependency Ratio, Container Port Traffic, Creative Goods Exports, Creative Services Exports, Foreign Value Added Share of Gross Exports, ICT Goods Exports, ICT Services Exports, Inbound Mobility Rate, Tertiary, Logistics Performance Index, Merchant Fleet by Country of Ownership, Outbound Mobility Ratio, Tertiary and Tariff Rate, Applied, Weighted Mean, All Products. They are listed rather than hidden, so the evidence on the page can be checked against it.
09Keep reading
Explore further
Comoros, topic by topic
- Governance & Institutions174th of 194
- Economy & Innovation134th of 176
- Work & Labour133rd of 182
- Education & Knowledge165th of 196
- Health & Wellbeing159th of 200
- Development & Human Capital=168th of 196
- Environment & Sustainability=8th of 181
- Gender & Equality144th of 183
- Democracy & Civil Liberties=142nd of 198
- Peace & Security152nd of 177
- Risk & Resilience99th of 193
- Food & Agriculture152nd of 175
- Poverty & Inequality98th of 159
- Digital & Technology176th of 198
- The full Comoros profile
Nearby, on mobility & trade
The key statistics, for every country
10Method
Method, sources and how to cite
What this topic does not measure
Passport strength and freedom of movement for people are not measured with a key, because the data behind passport rankings is not licensed for reuse here. Trade as a share of the economy, remittance costs and student mobility are published here as context.
How the Mobility & Trade standing is decided, step by step
A standing is a place in a list, not a mark out of anything. This one is part of the Country Index 2026, and it is worked out like this.
- A few key indicators decide it; the rest are context. 4 indicators on this topic are keys and 27 are charted alongside them without a vote. That split is the point: if every statistic voted, importing five more of one kind would quietly change what the topic is about.
- Each key is read at one edition. ⚠ The keys behind this standing do not all describe the same year — they run from 2023 to 2025, because publishers release on their own schedules. Read the standing as “how this country places now”, not as a snapshot of one year.
- Every country’s published value is turned into a place within that one key’s own field, and then expressed as a share of that field — how far down this key’s list the country sits, rather than how many countries are above it. Keys where a higher published number is worse (terrorism, hunger, disaster risk) are turned round first, so the good end is always the same end.
- Dividing by the field first is the whole reason this works. A place carries the size of its list inside it: 22nd of 44 and 108th of 215 are the same showing, and averaging the numbers 22 and 108 says loudly that they are not. Fields on this site run from about 44 countries to about 215, so averaging raw places would reward a country for happening to be measured in small ones. Dividing each place by its own field removes the size and leaves only the showing.
- The shares are averaged, plainly. One key, one vote — no key is weighted above another, because any weighting would be this site’s opinion presented as a measurement. Countries are then put in order by that average, and the average itself is never published. It is our arithmetic with nothing anchoring it, so printing it would invite it to be read as a measurement somebody made. The position it produces, the band, and the keys it was built from are all published instead — every one of them checkable against the tables on this page.
- A country needs 2 of this topic’s 4 keys — half, rounded up, and never fewer than 2. A standing built from one reading, printed beside one built from four, is two different things sharing a column heading. 177 countries clear the bar here.
- A key has to earn its vote every edition. It must measure at least 120 countries (below that it starts measuring who was surveyed rather than the world), it must not have more than 10% of its field tied at either end, and it must not repeat another key in the same topic — Spearman correlation above 0.92 counts as repeating. A topic needs at least 2 surviving keys to place anyone at all; this one has 4.
- A standing is relative, and the grouping is ours. It says where a country places against the others measured alongside it, so it moves when they move. The publishers listed on this page did not agree to be read together, and each measures its subject its own way: the underlying numbers are theirs, the ordering on top is this site’s — the same method as the rest of the Country Index, applied to one subject instead of all of them.
The key statistics and their licences
- Liner Shipping Connectivity Index — UN Trade and Development (UNCTAD), CC BY 3.0 IGO
- Container Import Dwell Time — World Bank Group, CC BY 4.0
- Logistics Performance Index — World Bank Group, CC BY 4.0
- ICT Goods Exports — UN Trade and Development (UNCTAD), CC BY 3.0 IGO
The other 16 statistics on this page come from 6 publishers, each named beside its numbers, with every edition and licence on the datasets pages.
The standing itself is part of the Country Index 2026, published under CC BY-SA 4.0.
Photographs
Comoros’s banner and the countries placed highest, from their profiles: Wikimedia Commons, shown in greyscale, each used under the licence named.
- Comoros (banner) — Woodlouse derivative work: Jjtkk, CC BY-SA 2.0
- Singapore — Khairul Nizam ., CC BY 2.0
- Macau — Diego Delso, CC BY-SA 3.0
- Hong Kong — Base64 and Derivative work by Globe-trotter, CC BY-SA 3.0
Cite this page
Nations Inquiry (2026). Comoros: Mobility & Trade — standing and statistics, Country Index 2026. https://nationsinquiry.com/countries/comoros/mobility