Dataset · World Bank Group
Prosperity Gap
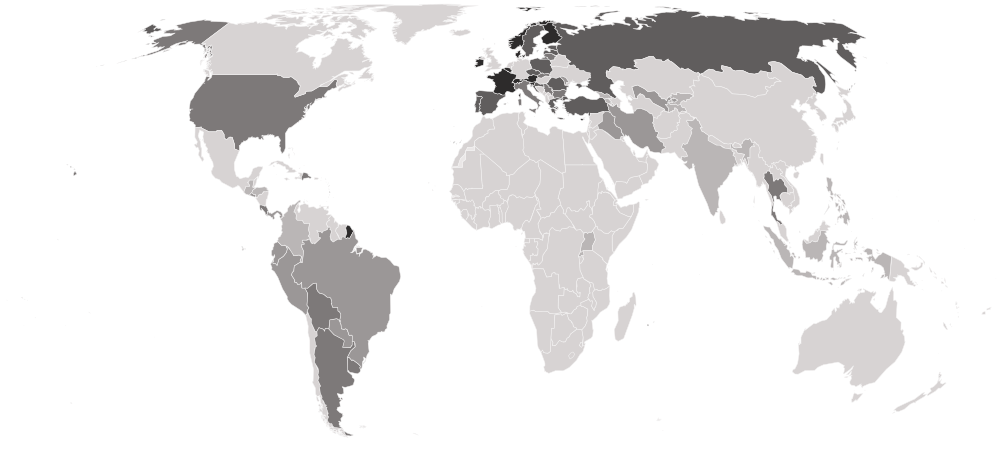
22 editions, 2002–2023 · 60 countries
The prosperity gap is the average factor by which a country’s incomes would have to be multiplied for everyone to reach a prosperity standard of $28 a day. It weights the poorest most heavily, so unlike a poverty headcount it keeps moving long after extreme poverty has been eliminated.
This site holds every edition from 2002 to 2023, read from World Bank Group’s own data and stored exactly as published.
Prosperity Gap · the file
- Newest
- Prosperity Gap, 2023 compilation
- Held
- 22 editions · 1,737 rows
- Licence
- CC BY 4.0
0122 editions
Every edition
Newest first. Each opens the full table for that edition, and each downloads as a CSV.
| Edition | Countries | Change | Read | Download |
|---|---|---|---|---|
| Prosperity Gap, 2023 compilationNewest | 60 | +9 −22 | September 26, 2026 | CSV |
| Prosperity Gap, 2022 compilation | 73 | +17 −26 | September 26, 2026 | CSV |
| Prosperity Gap, 2021 compilation | 82 | +23 −12 | September 26, 2026 | CSV |
| Prosperity Gap, 2020 compilation | 71 | +9 −17 | September 26, 2026 | CSV |
| Prosperity Gap, 2019 compilation | 79 | +12 −27 | September 26, 2026 | CSV |
| Prosperity Gap, 2018 compilation | 94 | +27 −12 | September 26, 2026 | CSV |
| Prosperity Gap, 2017 compilation | 79 | +11 −16 | September 26, 2026 | CSV |
| Prosperity Gap, 2016 compilation | 84 | +19 −22 | September 26, 2026 | CSV |
| Prosperity Gap, 2015 compilation | 87 | +22 −19 | September 26, 2026 | CSV |
| Prosperity Gap, 2014 compilation | 84 | +19 −13 | September 26, 2026 | CSV |
| Prosperity Gap, 2013 compilation | 78 | +12 −21 | September 26, 2026 | CSV |
| Prosperity Gap, 2012 compilation | 87 | +22 −17 | September 26, 2026 | CSV |
Show all 22 editions
| Edition | Countries | Change | Read | Download |
|---|---|---|---|---|
| Prosperity Gap, 2011 compilation | 82 | +18 −23 | September 26, 2026 | CSV |
| Prosperity Gap, 2010 compilation | 87 | +25 −21 | September 26, 2026 | CSV |
| Prosperity Gap, 2009 compilation | 83 | +21 −17 | September 26, 2026 | CSV |
| Prosperity Gap, 2008 compilation | 79 | +21 −15 | September 26, 2026 | CSV |
| Prosperity Gap, 2007 compilation | 73 | +14 −23 | September 26, 2026 | CSV |
| Prosperity Gap, 2006 compilation | 82 | +23 −22 | September 26, 2026 | CSV |
| Prosperity Gap, 2005 compilation | 81 | +22 −16 | September 26, 2026 | CSV |
| Prosperity Gap, 2004 compilation | 75 | +22 −16 | September 26, 2026 | CSV |
| Prosperity Gap, 2003 compilation | 69 | +26 −25 | September 26, 2026 | CSV |
| Prosperity Gap, 2002 compilation | 68 | — | September 26, 2026 | CSV |
Every edition in one file, one row per country per edition: prosperity-gap-all-editions-nations-inquiry.csv
025 columns
What’s in the file
Every column, what it holds, how it is stored and what its values look like — what a reader needs before opening the file.
| Column | What it holds | Stored as | Range, 2023 | Distinct | Empty | Spread |
|---|---|---|---|---|---|---|
CountrycountryName | The country’s name, as this file spells it. | Text | — | 60 | 0 | |
ISO Codecountry_codeIdentifier | The ISO 3166-1 alpha-3 code, added by this site. Every table here joins on it. | Text · 3 letters | — | 60 | 0 | |
Average factor incomes must rise by to reach $28 a dayprosperity_gapHeadline | The headline figure: Average factor incomes must rise by to reach $28 a day. | Number · up to 4 decimals | 0.406 Luxembourg12.065  Ugandamiddle 1.754 | 60 | 0 | |
Survey measureswelfare_typeGrouping | World Bank Group’s own grouping of the country. | Text | — | 2 | 0 | |
Survey yearsurvey_yearReading year | The year this country’s reading describes. Readings from different years sit side by side. | Year | — | 6 | 0 |
Profiled from the newest file. Range: the lowest and highest value, with the country holding it when only one does. Spread: countries in ten equal steps from lowest to highest. A higher value is the worse result.
03169 countries across every edition
Who is covered
How many countries each edition holds, continent by continent, who joined and who left, and which places this site covers that the dataset never has.
| 2012 | 2013 | 2014 | 2015 | 2016 | 2017 | 2018 | 2019 | 2020 | 2021 | 2022 | 2023 | |
|---|---|---|---|---|---|---|---|---|---|---|---|---|
| Africa | 9 | 5 | 9 | 13 | 7 | 7 | 15 | 6 | 5 | 15 | 7 | 2 |
| Americas | 17 | 16 | 18 | 16 | 17 | 16 | 19 | 15 | 14 | 15 | 16 | 15 |
| Asia | 20 | 16 | 17 | 17 | 20 | 17 | 21 | 16 | 15 | 17 | 20 | 14 |
| Europe | 39 | 38 | 39 | 40 | 39 | 39 | 38 | 38 | 36 | 34 | 30 | 28 |
| Oceania | 2 | 3 | 1 | 1 | 1 | 0 | 1 | 4 | 1 | 1 | 0 | 1 |
| All | 87 | 78 | 84 | 87 | 84 | 79 | 94 | 79 | 71 | 82 | 73 | 60 |
The newest 12 of 22 editions.
Who joined and who left
- 2023 compilation
 + Guatemala
 + Honduras
 + Iraq
 + Kiribati
 + Panama
 + Philippines
 + Palestine
 + Rwanda+ Uganda
 − Bangladesh
 − Bhutan
 − Canada
 − Chile
 − China
 − Germany
 − Equatorial Guinea
 − Israel
 − Kenya
 − Lebanon
 − Mexico
 − Mongolia
 − Mozambique
 − Nigeria
 − Nepal
 − Suriname
 − Syria
 − Chad
 − Vietnam
 − Kosovo
 − South Africa
 − Zambia
- 2022 compilation+ Bangladesh+ Bhutan+ Chile+ Equatorial Guinea
 + India+ Lebanon+ Mexico+ Mongolia+ Mozambique+ Nigeria+ Nepal+ Suriname+ Syria+ Chad+ Vietnam+ South Africa+ Zambia
 − Benin
 − Burkina Faso
 − Bosnia and Herzegovina
 − Central African Republic
 − Côte d’Ivoire
 − Cameroon
 − Egypt
 − Ethiopia
 − United Kingdom
 − Guinea-Bissau
 − Jamaica
 − Kazakhstan
 − South Korea
 − Madagascar
 − Mali
 − Montenegro
 − Malaysia
 − Niger
 − Netherlands− Panama− Philippines
 − Senegal
 − Togo
 − Tonga
 − Tunisia
 − Taiwan
- 2021 compilation+ Benin+ Burkina Faso+ Bosnia and Herzegovina+ Central African Republic+ Côte d’Ivoire+ Cameroon+ Egypt+ Ethiopia+ Guinea-Bissau+ Jamaica+ Madagascar+ Mali+ Malaysia+ Niger+ Panama+ Philippines+ Senegal
 + El Salvador+ Togo
 + Tajikistan+ Tonga+ Tunisia
 + Uzbekistan
 − Albania
 − Australia
 − Burundi
 − Belarus− Chile
 − DR Congo
 − Comoros
 − Gambia
 − Japan− Mexico
 − Ukraine− Vietnam
- 2020 compilation+ Australia+ Burundi+ Chile+ DR Congo+ Comoros+ Gambia+ Kenya+ Mexico+ Vietnam− Egypt
 − Fiji− Honduras
 − Iceland− Kiribati
 − Sri Lanka
 − Maldives
 − Marshall Islands
 − North Macedonia− Mozambique
 − Mauritania
 − Malawi− Panama− El Salvador− Uganda
 − Vanuatu
 − Zimbabwe
- 2019 compilation+ Egypt+ Fiji+ Kiribati+ Sri Lanka+ Maldives+ Marshall Islands+ Mozambique+ Mauritania+ Malawi+ Uganda+ Vanuatu+ Zimbabwe
 − Angola
 − United Arab Emirates− Australia− Benin− Burkina Faso
 − Belize− Côte d’Ivoire
 − Guinea− Guinea-Bissau
 − Grenada− Jamaica
 − Laos− Mexico− Mali− Mongolia− Malaysia− Niger− Nigeria
 − Pakistan− Philippines− Senegal
 − Sierra Leone
 − Seychelles− Chad− Togo
 − Tanzania− Vietnam
- 2018 compilation+ Angola+ United Arab Emirates+ Australia+ Benin+ Burkina Faso+ Belize+ Côte d’Ivoire+ Guinea+ Guinea-Bissau+ Grenada+ Jamaica+ Laos+ Mexico+ Mali+ Mongolia+ Malaysia+ Niger+ Nigeria+ Pakistan+ Philippines+ Senegal+ Sierra Leone+ Seychelles+ Chad+ Togo+ Tanzania+ Vietnam− Bhutan− Chile
 − Djibouti− Egypt
 − Gabon
 − Hungary
 − Lesotho
 − Myanmar
 − Mauritius
 − Qatar
 − São Tomé and Príncipe− Zimbabwe
- 2017 compilation+ Bhutan+ Chile+ Djibouti+ Egypt+ Gabon+ Lesotho+ Myanmar+ Mauritius+ Qatar+ São Tomé and Príncipe+ Zimbabwe− Australia− Bangladesh
 − Barbados
 − Ghana
 − Liberia− Sri Lanka− Maldives− Mexico− Mongolia− Malawi− Palestine− Rwanda
 − South Sudan
 − Eswatini− Uganda− Vietnam
- 2016 compilation
 + Argentina+ Australia+ Bangladesh+ Barbados+ Ghana+ South Korea+ Liberia+ Sri Lanka+ Maldives+ Mexico+ Mongolia+ Malawi+ Palestine+ Rwanda+ South Sudan+ Eswatini+ Taiwan+ Uganda+ Vietnam− Benin− Bosnia and Herzegovina
 − Botswana− Chile− Côte d’Ivoire
 − Cabo Verde− Egypt− Ethiopia− Gambia− Kenya
 − Saint Lucia− Myanmar− Malaysia
 − Namibia− Nigeria− Pakistan− Philippines− Togo− Tajikistan− Tonga− Tunisia− Zambia
Not in this dataset · 56 places this site covers
World Bank Group gives no figure for these in any edition held here. It is the publisher’s choice of scope, and each place’s profile shows what is measured.
 Afghanistan
 American Samoa
 Andorra
 Anguilla
 Antigua and Barbuda
 Aruba
 Bahamas
 Bahrain
 Bermuda
 British Virgin Islands
 Brunei
 Cambodia
 Cayman IslandsChannel Islands
 Cook Islands
 Cuba
 Curaçao
 Dominica
 Eritrea
 Faroe Islands
 French Polynesia
 Gibraltar
 Greenland
 Guam
 Guyana
 Hong Kong
 Isle of Man
 Kuwait
 Libya
 Liechtenstein
 Macau
 Monaco
 Montserrat
 New Caledonia
 New Zealand
 Niue
 North KoreaNorthern Cyprus
 Northern Mariana Islands
 Oman
 Palau
 Puerto Rico
 Saint Kitts and Nevis
 Saint Martin
 Saint Vincent and the Grenadines
 San Marino
 Saudi Arabia
 Singapore
 Sint Maarten
 SomaliaSomaliland
 Trinidad and Tobago
 Turkmenistan
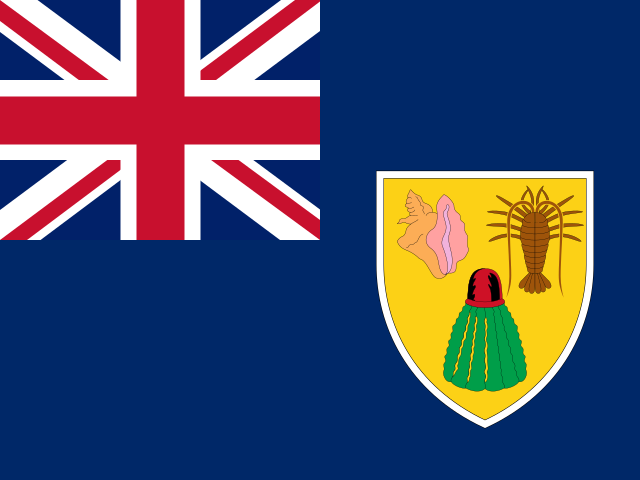 Turks and Caicos Islands
 United States Virgin Islands
 Vatican City
04Provenance
Where it comes from
The path from the publisher to this page, and what was checked and changed on the way.
1 · Publisher
World Bank Group
2 · Their file
Prosperity Gap 2023
3 · Read by this site
September 26, 2026
Imported by a script that parses each figure and writes it down unrounded.4 · Stored as
22 files, one per edition
Each downloads as a CSV, or every edition together as prosperity-gap-all-editions-nations-inquiry.csv5 · Used on
Its statistic page, and every profile it measures
Precision
The headline is stored to 4 decimals, as published.
Rounded by this site
Never. Tables on screen may show fewer decimals; the files never do.
Changed by this site
Reshaped into one row per country: regional and income-group totals are left out, only the columns listed are kept, each row gets its ISO 3166 code, and some country names are brought to one spelling. No value is recalculated, rescaled or rounded.
Read from the World Bank’s Poverty and Inequality Platform rather than its indicator API (SI.SPR.PGAP), which rounds every value to one decimal.
05Reuse
Licence and credit
What the publisher’s licence lets you do, what it asks of you, and a credit line and citation ready to copy.
Licence · checked September 10, 2026
- Share and redistribute it
- Adapt it and build on it
- Use it commercially
- Credit the publisher
- Say what you changed
Share, adapt and use commercially. Credit the publisher and say if you changed anything.
A credit line
Source: World Bank Group, Prosperity Gap, via Nations Inquiry.
Cite this dataset
World Bank Group. Prosperity Gap, 2002–2023 [data set]. As held by Nations Inquiry, https://nationsinquiry.com/datasets/prosperity-gap
The publisher’s own citation: World Bank. Poverty and Inequality Platform. Washington, DC: World Bank Group.
Plain-language summary, not legal advice. The licence text is what binds.
06Questions
Prosperity Gap: questions and answers
What is the Prosperity Gap?
The prosperity gap is the average factor by which a country’s incomes would have to be multiplied for everyone to reach a prosperity standard of $28 a day. It weights the poorest most heavily, so unlike a poverty headcount it keeps moving long after extreme poverty has been eliminated.
Which editions of the Prosperity Gap can I download?
All 22, from 2002 to 2023, each as a CSV file, or every edition together in one CSV.
Does World Bank Group rank countries on it?
No. World Bank Group publishes values only. The positions shown on this site are derived by ordering the published values, and are labelled as ours.
Can I use it commercially?
Yes, under CC BY 4.0, with credit to World Bank Group. The licence text is linked on this page.