Loading…
ESMAP · RISE Energy Efficiency Policy Score
Energy efficiency policy by country
How strong are a country's laws and policies for using energy efficiently?
Of the 140 countries compared in 2023, South Korea had the highest reading, 95.926, and Burundi had the lowest reading, 1.975. In the middle country the figure was 48.225. Among the 140 countries measured in every edition since 2010, the middle one moved from 8.951 to 48.225.
Part ofEnergy
Energy efficiency policy · 2023
Context statistic

Highest of 140South Korea
95.926012023 · values only
Who leads
The three countries at the highest end of 140 compared, the three at the other end, and the first on each continent.
 1
1Photo: Unknown author · CC BY-SA 2.0, greyscale
 2
2 3
3Photo: grin derivative work: Jjtkk · CC BY-SA 3.0, greyscale
Lowest in 2023
 Burundi1.975
 Republic of the Congo2.222
 Eritrea3.926
Where a country sits says how it compares with the others measured, and nothing about why.
02Every measured country
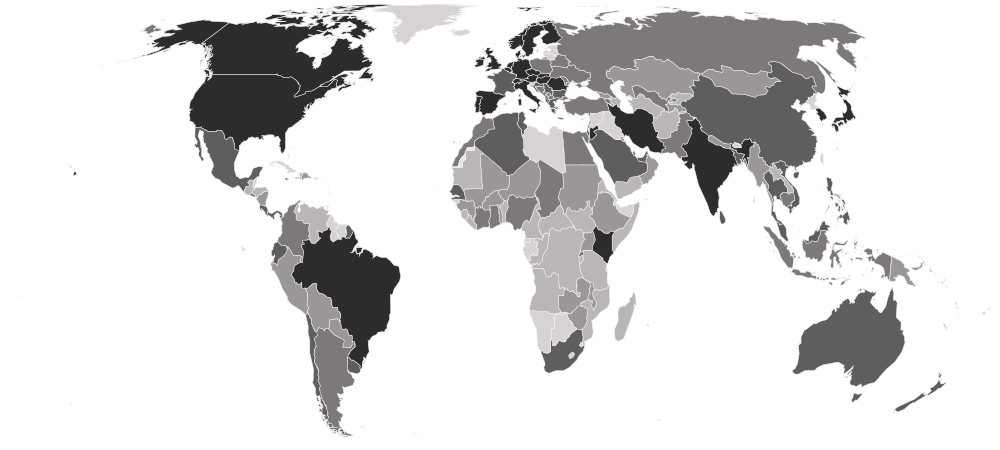
Energy efficiency policy on a map
Each country is shaded by its value, in five groups holding the same number of countries. Hover a country for its value, or select it to open its profile. Below the map, each continent’s middle country.
Darker is a higher value — the better end.
- 1.975–19.691
- 21.265–35.981
- 36.204–57.222
- 57.253–70.741
- 71.105–95.926
- No reading in 2023
- Europe
75.148
the middle country, of 33 measured · 49 members
 Germany88.333
 Ukraine42.679
Highest and lowest reading in Europe.
- Asia
48.673
the middle country, of 41 measured · 52 members
South Korea95.926 Yemen4.481
Highest and lowest reading in Asia.
- Americas
43.025
the middle country, of 22 measured · 48 members
 Canada81.790
 Haiti7.747
Highest and lowest reading in Americas.
- Oceania
25.494
the middle country, of 5 measured · 21 members
 Australia70.031
 Solomon Islands17.623
Highest and lowest reading in Oceania.
- Africa
24.099
the middle country, of 39 measured · 55 members
 Kenya73.889Burundi1.975
Highest and lowest reading in Africa.
- Every region
20 sub-regions, highest middle country first
- Western Europe
79.870
the middle country, of 6 measured · 9 members
Germany88.333 France70.580
Highest and lowest reading in Western Europe.
- Northern Europe
77.713
the middle country, of 6 measured · 13 members
 Denmark83.778
 Finland73.852
Highest and lowest reading in Northern Europe.
- South-eastern Asia
64.494
the middle country, of 9 measured · 11 members
 Singapore80.833
 Laos15.383
Highest and lowest reading in South-eastern Asia.
- Southern Europe
60.123
the middle country, of 11 measured · 17 members
 Italy85.086
 Albania46.049
Highest and lowest reading in Southern Europe.
- Eastern Europe
59.287
the middle country, of 10 measured · 10 members
 Hungary86.111Ukraine42.679
Highest and lowest reading in Eastern Europe.
- Northern Africa
54.438
the middle country, of 5 measured · 6 members
 Tunisia62.401
 Sudan24.623
Highest and lowest reading in Northern Africa.
- Southern Asia
52.469
the middle country, of 8 measured · 9 members
 India80.741
 Maldives14.815
Highest and lowest reading in Southern Asia.
- South America
42.978
the middle country, of 10 measured · 12 members
 Brazil71.852
 Venezuela18.611
Highest and lowest reading in South America.
- Central America
38.272
the middle country, of 7 measured · 8 members
 Mexico61.728
 Guatemala14.784
Highest and lowest reading in Central America.
- Western Asia
36.204
the middle country, of 15 measured · 19 members
 Jordan71.105Yemen4.481
Highest and lowest reading in Western Asia.
- Central Asia
32.130
the middle country, of 5 measured · 5 members
 Uzbekistan51.574
 Turkmenistan13.802
Highest and lowest reading in Central Asia.
- Western Africa
30.123
the middle country, of 13 measured · 16 members
 Senegal61.469
 Liberia4.753
Highest and lowest reading in Western Africa.
- Eastern Africa
15.463
the middle country, of 14 measured · 19 members
Kenya73.889Burundi1.975Highest and lowest reading in Eastern Africa.
- Middle Africa
12.426
the middle country, of 6 measured · 9 members
 Chad39.907Republic of the Congo2.222
Highest and lowest reading in Middle Africa.
- Australia and New Zealand
2 of 2 measured — too few for a middle: Australia, New Zealand.
Australia70.031 New Zealand63.611
Highest and lowest reading in Australia and New Zealand.
- Caribbean
3 of 24 measured — too few for a middle: Dominican Republic, Haiti, Jamaica.
 Jamaica49.235Haiti7.747
Highest and lowest reading in Caribbean.
- Eastern Asia
4 of 8 measured — too few for a middle: China, Japan, Mongolia, South Korea.
South Korea95.926 Mongolia32.870
Highest and lowest reading in Eastern Asia.
- Melanesia
3 of 5 measured — too few for a middle: Papua New Guinea, Solomon Islands, Vanuatu.
 Papua New Guinea25.494Solomon Islands17.623
Highest and lowest reading in Melanesia.
- Northern America
2 of 4 measured — too few for a middle: Canada, United States.
Canada81.790 United States81.642
Highest and lowest reading in Northern America.
- Southern Africa
1 of 5 measured — too few for a middle: South Africa.
 South Africa66.111
Highest and lowest reading in Southern Africa.
03The whole field at once
The spread
140 countries, one dot each, on one scale — further right is a higher value. Half the countries are above 48.225; a quarter are above 66.975, and a quarter below 24.023. The bar in each row marks that continent’s middle country.
04All 140 ever measured
Every country
In order, highest value first. No rank or position is shown: too many countries share the same value for an order to mean anything. A high score means the policy framework exists, not that the country is efficient in practice — a country can write good rules and enforce them weakly. The nine parts of the score show which rules are in place and which are missing.
Showing 25 of 140 countries
































































































Values for 2023. The change column compares 2023 with 2022 only; the sparkline covers the recent editions.
052010–2023 · 14 reference years
Over time
Each point is one year from 2010 to 2023, all scored on the same method by the 2024 edition of RISE, so the line can be read end to end. A step up usually marks a law, a standard or an agency coming into force.
- the middle country
- the middle half of countries
- the middle of the 140 countries measured every time
- each continent’s middle country
The same, year by year
| Year | Countries | Middle country | Middle half | Measured every time |
|---|---|---|---|---|
| 2023 | 140 | 48.225 | 24.023 – 66.975 | 48.225 |
| 2022 | 140 | 46.142 | 22.722 – 63.642 | 46.142 |
| 2021 | 140 | 42.497 | 19.529 – 63.218 | 42.497 |
| 2020 | 140 | 40.552 | 19.213 – 62.198 | 40.552 |
| 2019 | 140 | 38.809 | 17.269 – 60.801 | 38.809 |
| 2018 | 140 | 32.528 | 14.733 – 59.715 | 32.528 |
| 2017 | 140 | 31.833 | 12.901 – 58.427 | 31.833 |
| 2016 | 140 | 27.778 | 10.696 – 54.236 | 27.778 |
| 2015 | 140 | 24.414 | 7.863 – 49.983 | 24.414 |
| 2014 | 140 | 19.735 | 4.444 – 43.380 | 19.735 |
| 2013 | 140 | 17.966 | 3.667 – 40.958 | 17.966 |
| 2012 | 140 | 14.602 | 3.241 – 32.843 | 14.602 |
| 2011 | 140 | 10.602 | 2.153 – 29.969 | 10.602 |
| 2010 | 140 | 8.951 | 1.574 – 24.927 | 8.951 |
062022 → 2023
Who rose and fell
The biggest changes in value between the two newest editions — reference years recalculated in one report, not two separate publications. Places are shown second, because they also move when other countries do.
Improved most
before → after Philippines26.086 → 70.401+44.315
- Senegal36.994 → 61.469+24.475
 Pakistan29.444 → 47.593+18.148
 Bangladesh41.574 → 57.346+15.772
 Uganda5.741 → 21.265+15.525
Declined most
before → afterNo country moved this way.
140 countries were measured in both 2022 and 2023.
07Across every edition
Energy efficiency policy in records
The extremes of the statistic. A record reached by more than one country names none of them.
Highest reading on record
95.926
Energy efficiency policy score (0–100)
Lowest reading on record
Reached 75 times by 15 countries — shared, so no holder is named
0.000
Energy efficiency policy score (0–100)
Biggest improvement between editions
+52.191
16.204 → 68.395
Most improved since first measured
+73.889
0.000 → 73.889
At the top most often
6 of 14
editions, alone at the first-listed end
08The parts of the index
Inside the number
World Bank Group (ESMAP) publishes the parts the headline is built from. Each part’s highest and lowest country, and its middle value.
| Part | Highest | Lowest | Middle country |
|---|---|---|---|
| Energy efficiency governance140 countries | 23 countries share 100.0 | Eritrea2.0 | 80.3 |
| Energy utility programmes140 countries | Singapore100 | Yemen0 | 43 |
| Industrial and commercial end users140 countries | 23 countries share 100 | 25 countries share 0 | 50 |
| Energy efficiency in the public sector140 countries | 18 countries share 100 | 29 countries share 0 | 50 |
| Financing mechanisms140 countries | 21 countries share 100 | 42 countries share 0 | 50 |
| Minimum energy performance standards140 countries | 4 countries share 100 | 26 countries share 0 | 50 |
| Energy labelling systems140 countries | 7 countries share 100 | 33 countries share 0 | 50 |
| Building energy codes140 countries | South Korea100 | 36 countries share 0 | 33 |
| Transport sector140 countries | 9 countries share 100 | 49 countries share 0 | 25 |
09The measure
About energy efficiency policy
The RISE energy efficiency score rates the policies and regulations a country has in place to make energy use more efficient — from national targets and building codes to appliance standards, labels and financing — on a scale of 0 to 100. It is published by the World Bank's Energy Sector Management Assistance Program and measures the rulebook, not the result.
What the number is: Energy efficiency policy score (0–100).
What it does not measure
It scores the policies and regulations on the books, not whether they are enforced or how efficiently the country actually uses energy.
10Where it fits
Connections
Its part in the Country Index, the statistics whose values line up most closely with it across countries, and others on the same subject.
In the Country Index
Context, with no vote
This statistic is published in full under Energy, but does not help decide any Country Index standing.
Moves with
Where energy efficiency policy is higher, these tend to be higher too.
- Government AI Readiness IndexKeyOxford Insights · 139 countries in commonρ 0.84
- Global Innovation IndexWorld Intellectual Property Organization · 121 countries in commonρ 0.84
- RISE Renewable Energy Policy ScoreESMAP · 140 countries in commonρ 0.83
Moves against
Where energy efficiency policy is higher, these tend to be lower.
- Population Under Age 15UN DESA Population Division · 140 countries in commonρ −0.75
- Crude Birth RateUN DESA Population Division · 140 countries in commonρ −0.73
- Gender Inequality IndexUNDP Human Development Report Office · 133 countries in commonρ −0.72
Rank correlation (ρ, from −1 to 1) across countries, on each statistic’s newest edition, out of 179 statistics sharing at least 80 countries with this one. Two statistics that move together do not cause each other.
11Keep reading
Explore further
The subject
The countries at either end
More from ESMAP
12Questions
Energy efficiency policy: questions and answers
Which country has the highest energy efficiency policy?
South Korea, at 95.926, among the 140 countries compared in 2023.
Which country has the lowest energy efficiency policy?
Burundi, at 1.975, among the 140 countries compared in 2023.
How many countries does the RISE Energy Efficiency Policy Score cover?
140 in 2023.
What is the world average energy efficiency policy?
This site does not calculate a world average, which would depend on how countries are weighted. In the middle country of the 140 compared in 2023, the figure was 48.225.
Is this World Bank Group (ESMAP)’s own ranking?
No ranking is shown. World Bank Group (ESMAP) publishes values only, and too many countries share the same value for an ordering to mean anything, so none is derived.
How often is the RISE Energy Efficiency Policy Score published?
This site holds 14 reference years, 2010–2023, all recalculated in World Bank Group (ESMAP)’s 2024 report on one method — not 14 separate publications.
Where does the data come from, and can I download it?
From World Bank Group (ESMAP), under CC BY 4.0. From World Bank Data360 (RISE), the 2024 edition's annual series. RISE's overall score is not used: it averages a different number of pillars for different countries. Every edition is on this site’s Datasets pages as a full table, and downloads as a CSV file with every value unrounded.
13Method
Sources, method and citation
Source
RISE Energy Efficiency Policy Score — World Bank Group (ESMAP)
From World Bank Data360 (RISE), the 2024 edition's annual series. RISE's overall score is not used: it averages a different number of pillars for different countries.
Newest edition
Report year 2023Data year 2023
Cite the source as: World Bank. Regulatory Indicators for Sustainable Energy (RISE) 2024. Washington, DC: World Bank / ESMAP.
Licence: CC BY 4.0, checked 2026-09-26.
How this page reads the numbers
- No rank or position is shown: World Bank Group (ESMAP) publishes values only, and too many countries share the same value for an ordering to mean anything.
- Which end is better follows the publisher’s own reading of the measure.
- A country is named at an end only when it holds that value alone. Where several share it, the page says how many and names none first.
- Values are stored exactly as published and trimmed only for display. “The middle country” is the median of the countries measured, not a world average.
The file itself, column by column — where it came from, what each column holds, and every edition as a CSV — is on its dataset page.
Photographs
The countries at the top of this statistic, from their profiles: Wikimedia Commons, shown in greyscale, each used under the licence named.
- South Korea — Unknown author, CC BY-SA 2.0
- Germany — dronepicr, CC BY 2.0
- Hungary — grin derivative work: Jjtkk, CC BY-SA 3.0
Cite this page
Nations Inquiry (2026). Energy efficiency policy by country: RISE Energy Efficiency Policy Score, data from World Bank Group (ESMAP). https://nationsinquiry.com/statistics/rise-energy-efficiency