
Photo: Gf uip · CC BY-SA 3.0 · via Wikimedia Commons, shown in greyscale
Topic 04 of 18 · Country Index 2026

Belgium: Education & Knowledge
How far does a country's schooling carry its children?
Belgium is placed 29th of 198 countries on education & knowledge in the Country Index 2026, from 3 of its 4 key statistics. Readings behind it: Out-of-School Rate, Primary 1.658 (2024); Participation in Organised Learning One Year Before Primary 98.31 (2024).
Share
Education & Knowledge
29th
of 198 countries placed
Placed from 3 of 4 key statistics
- 1.658Out-of-School Rate, Primary, 2024Out-of-school rate, primary age (%)
- 98.31Participation in Organised Learning One Year Before Primary, 2024Children one year before primary entry age in organised learning (%)
- 86.34Upper Secondary Completion Rate, 2025Upper secondary completion rate (%)
- —Government Spending on Education, 2023No reading for this country
01The evidence
The 4 key statistics that decide it
Only these place Belgium on education & knowledge — one vote each. Every value is the publisher’s own, read at the edition the Country Index 2026 used — or, for a survey-based key, each country’s latest reading; the grey ticks are every other country it was compared with, lowest on the left.
Key 1 of 4
Out-of-School Rate, Primary
UNESCO Institute for Statistics (UIS)
Latest reading per country, 2014–2024 · Belgium’s is from 2023 · CC BY-SA 4.0
1.658
Out-of-school rate, primary age (%)
Lower is better
Belgium: 1.658. Across the 192 countries at their latest reading, values run from 0.004 (United Arab Emirates) to 65.6 (Equatorial Guinea); the world median is 3.691.
- World median
- 3.691
- Best in Western Europe
- 0.143 Switzerland
- Land neighbours
- Germany 0.274 · France 0.204 · Luxembourg 0.256 · Netherlands 0.519
Key 2 of 4
Participation in Organised Learning One Year Before Primary
UNESCO Institute for Statistics (UIS)
Latest reading per country, 2014–2024 · Belgium’s is from 2023 · CC BY-SA 4.0
98.31
Children one year before primary entry age in organised learning (%)
Higher is better
Belgium: 98.31. Across the 187 countries at their latest reading, values run from 3.411 (Yemen) to 100 (United Arab Emirates); the world median is 85.9.
- World median
- 85.9
- Best in Western Europe
- 99.76 France
- Land neighbours
- Germany 98.37 · France 99.76 · Luxembourg 99.45 · Netherlands 98.33
Key 3 of 4
Upper Secondary Completion Rate
UNESCO Institute for Statistics (UIS)
2025 edition · data for 2025 · CC BY-SA 4.0
86.34
Upper secondary completion rate (%)
Higher is better
Belgium: 86.34. Across the 164 countries in this edition, values run from 2.13 (South Sudan) to 99.27 (South Korea); the world median is 64.87.
- World median
- 64.87
- Best in Western Europe
- 92.96 Switzerland
- Land neighbours
- Germany 80.95 · France 87.56 · Luxembourg 81.68 · Netherlands 79.98
Key 4 of 4
Government Spending on Education
UNESCO Institute for Statistics (UIS)
2023 edition · data for 2023 · CC BY-SA 4.0
No reading
Government expenditure on education (% of GDP)
Higher is better
UIS publishes no 2023 figure for Belgium, so the standing rests on the other keys.
Across the 123 countries in this edition, values run from 0 (Somalia) to 16.39 (Kiribati); the world median is 3.709.
- World median
- 3.709
- Best in Western Europe
- 1.732 Monaco
02Over time
Which way Belgium is moving
Each key’s published value, edition by edition, beside the world median. The Country Index 2026 is the first edition of the standing, so the standing itself has no history to chart yet.
Out-of-School Rate, Primary
Out-of-school rate, primary age (%) · lower is better
BelgiumWorld median
Belgium rose from 0.117 in 2001 to 1.658 in 2023; the world median went from 4.051 to 3.393.
Every year’s figures
Year Belgium World median 2024 — 3.691 2023 1.6583 3.393 2022 1.2242 3.002 2021 1.4740 3.330 2020 1.2293 2.678 2019 1.3475 2.758 2018 1.3384 2.439 2017 1.3822 2.907 2016 1.9190 2.954 2015 1.8512 3.052 2014 1.8311 3.904 2013 1.8078 3.413 2012 1.8776 3.408 2011 2.1010 3.626 2010 1.2954 3.491 2009 1.2289 3.577 2008 1.0943 3.878 2007 0.9266 4.029 2006 0.7643 4.338 2005 0.5498 4.571 2004 0.5901 3.791 2003 0.1189 4.412 2002 0.0883 4.144 2001 0.1166 4.051 2000 — 8.642 Participation in Organised Learning One Year Before Primary
Children one year before primary entry age in organised learning (%) · higher is better
BelgiumWorld median
Belgium fell from 99.91 in 2001 to 98.31 in 2023; the world median went from 80.76 to 87.61.
Every year’s figures
Year Belgium World median 2024 — 85.9 2023 98.3112 87.6 2022 98.6437 87.7 2021 98.4551 87.0 2020 98.7942 88.3 2019 98.6374 88.8 2018 98.6811 89.6 2017 98.6810 87.4 2016 98.2494 87.9 2015 98.2402 88.2 2014 98.5215 89.2 2013 98.4540 88.0 2012 98.3393 85.4 2011 98.1056 86.2 2010 99.1407 86.1 2009 99.2728 84.8 2008 99.4556 85.8 2007 99.6002 86.7 2006 99.7297 84.0 2005 99.8834 82.2 2004 99.6696 81.8 2003 99.9858 78.3 2002 99.8715 80.0 2001 99.9096 80.8 2000 — 66.3 Upper Secondary Completion Rate
Upper secondary completion rate (%) · higher is better
BelgiumWorld median
Belgium rose from 78.88 in 2000 to 86.34 in 2025; the world median went from 38 to 64.87.
Every year’s figures
Year Belgium World median 2025 86.34 64.9 2024 86.05 65.0 2023 85.71 64.2 2022 85.40 63.6 2021 85.11 62.9 2020 84.80 62.2 2019 84.44 61.5 2018 84.12 60.9 2017 83.79 60.5 2016 83.37 60.1 2015 82.81 58.9 2014 82.23 57.0 2013 81.58 54.7 2012 81.00 52.4 2011 80.52 50.9 2010 80.15 49.5 2009 79.98 48.5 2008 79.89 47.4 2007 79.62 46.2 2006 79.31 45.0 2005 79.00 43.8 2004 78.82 42.9 2003 78.78 41.6 2002 78.85 40.3 2001 78.87 39.0 2000 78.88 38.0 Government Spending on Education
Government expenditure on education (% of GDP) · higher is better
BelgiumWorld median
Belgium rose from 5.796 in 2005 to 6.276 in 2022; the world median went from 4.056 to 4.057.
Every year’s figures
Year Belgium World median 2023 — 3.7092 2022 6.276 4.0570 2021 6.381 4.2611 2020 6.755 4.4056 2019 6.324 4.1407 2018 6.389 4.2159 2017 6.449 4.1401 2016 6.486 4.2342 2015 6.470 4.2386 2014 6.559 4.2005 2013 6.601 4.3493 2012 6.566 4.0348 2011 6.385 3.9987 2010 6.441 4.1396 2009 6.435 4.6638 2008 6.333 4.4226 2007 — 4.1717 2006 — 4.0593 2005 5.796 4.0557 2004 — 3.9745 2003 — 4.1595 2002 — 4.0173 2001 — 4.1002 2000 — 3.8861
03In context
Belgium beside its neighbours
A position reads best beside the countries around it. Every position below is a place among all 198 countries on education & knowledge, never a place within the region.
Belgium and the countries it borders
Standing among all 198; the key columns are the publishers’ own values.
| Country | Standing | Out-of-School Rate, PrimaryOut-of-school rate, primary age (%) | Participation in Organised Learning One Year Before PrimaryChildren one year before primary entry age in organised learning (%) | Upper Secondary Completion RateUpper secondary completion rate (%) | Government Spending on EducationGovernment expenditure on education (% of GDP) |
|---|---|---|---|---|---|
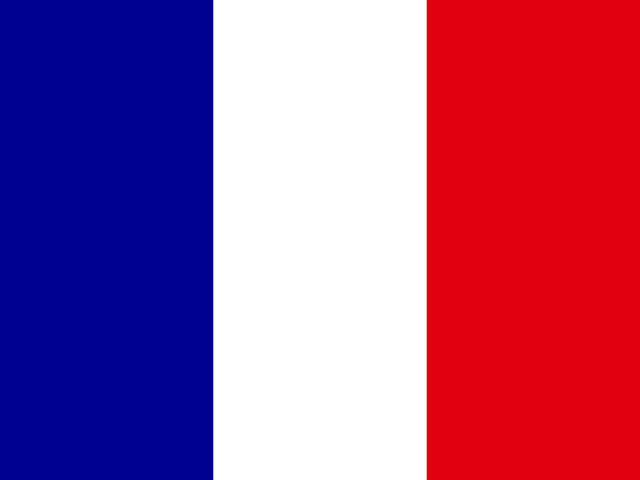 France | 10th | 0.204 | 99.76 | 87.56 | — |
 Luxembourg | 17th | 0.256 | 99.45 | 81.68 | — |
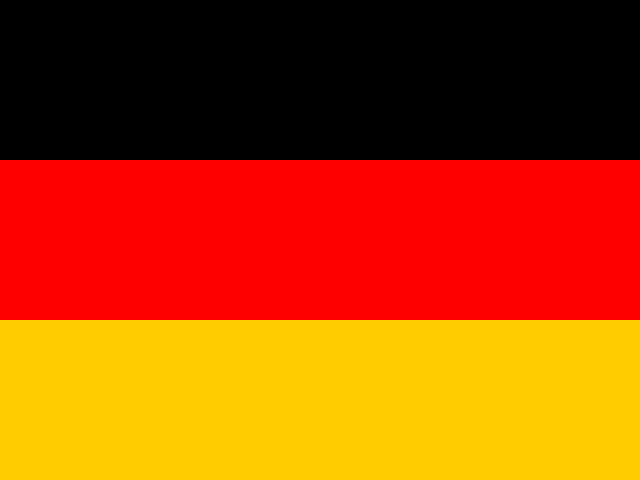 Germany | =19th | 0.274 | 98.37 | 80.95 | — |
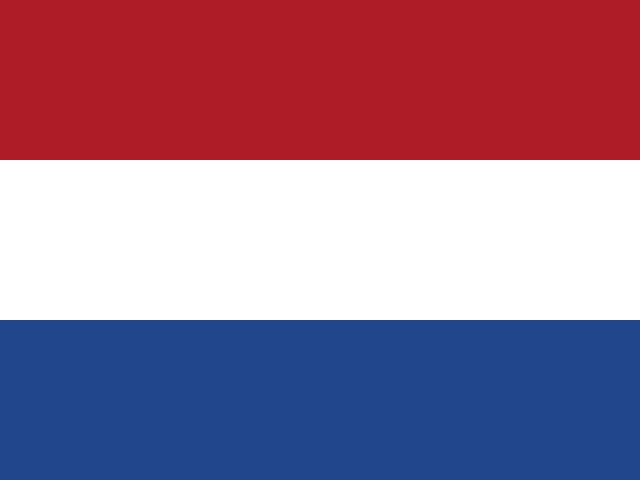 Netherlands | 21st | 0.519 | 98.33 | 79.98 | — |
| Belgium | 29th | 1.658 | 98.31 | 86.34 | — |
“—”: no published reading in that edition. What a standing is
Across Western Europe
Every country in the sub-region, by its place among all 198.
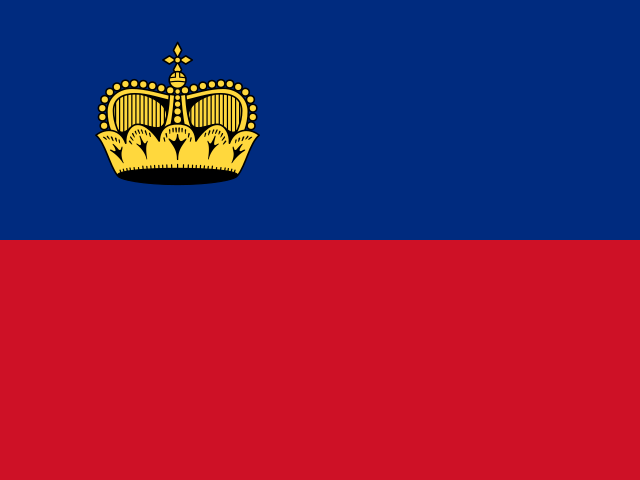
Placed either side on education & knowledge
The countries immediately above and below Belgium in the topic’s list.




04Context, no vote
Where Belgium is ahead of the world, and behind
28 more statistics filed under education & knowledge, published in full and deliberately given no vote in the standing. Select a row for the publisher, the rank and the links.
Ahead of the world median20
Statistics on which Belgium does better than the middle country measured.
Academic Freedom IndexV-Dem Institute, University of Gothenburg · 2025 · world median 0.6190.9460.619No real change since 2015
Belgium: 0.946 · world median 0.619 · Academic freedom index (0–1). V-Dem Institute, University of Gothenburg, 2025 edition, data for 2025.
Published values in that edition run from 0.019 to 0.978; higher is better.
Position 3rd of 176 · derived.
Expected Years of SchoolingUNDP Human Development Report Office · 2023 · world median 13.341913.34▼ Worsened since 2013
Belgium: 19 · world median 13.34 · Expected years of schooling. UNDP Human Development Report Office, 2023 edition, data for 2023.
Published values in that edition run from 5.635 to 21.69; higher is better.
Position 8th of 195 · derived.
Researchers per Million InhabitantsUIS · 2024 · world median 701.955,990701.95No earlier reading
Belgium: 5,990 · world median 701.95 · Researchers per million inhabitants (full-time equivalent). UNESCO Institute for Statistics (UIS), 2024 edition, data for 2024.
Published values in that edition run from 1.446 to 18,130; higher is better.
Position 11th of 145 · derived.
Research and Development SpendingUIS · 2023 · world median 0.8143.2720.814▲ Improved since 2013
Belgium: 3.272 · world median 0.814 · Gross domestic expenditure on R&D (% of GDP). UNESCO Institute for Statistics (UIS), 2023 edition, data for 2023.
Published values in that edition run from 0.006 to 6.346; higher is better.
Position 7th of 84 · derived.
Bachelor's or Higher AttainmentUIS · 2023 · world median 19.8637.4119.86▼ Worsened since 2013
Belgium: 37.41 · world median 19.86 · Adults 25+ who completed a bachelor's degree or higher (%). UNESCO Institute for Statistics (UIS), 2023 edition, data for 2023.
Published values in that edition run from 1.135 to 52.72; higher is better.
Position 8th of 90 · derived.
Harmonized Test ScoresWorld Bank Group · 2020 · world median 414.32516.81414.32No real change since 2010
Belgium: 516.81 · world median 414.32 · Harmonized test score (TIMSS-equivalent points; 300 = minimum, 625 = advanced attainment). World Bank Group, 2020 edition, data for 2020.
Published values in that edition run from 304.92 to 575.27; higher is better.
Position 19th of 172 · derived.
Learning-Adjusted Years of SchoolWorld Bank Group · 2020 · world median 7.94111.187.941▲ Improved since 2010
Belgium: 11.18 · world median 7.941 · Learning-adjusted years of school (0–14). World Bank Group, 2020 edition, data for 2020.
Published values in that edition run from 2.207 to 12.81; higher is better.
Position 20th of 172 · derived.
Mean Years of SchoolingUNDP Human Development Report Office · 2023 · world median 9.93312.699.933▲ Improved since 2013
Belgium: 12.69 · world median 9.933 · Mean years of schooling (adults 25+). UNDP Human Development Report Office, 2023 edition, data for 2023.
Published values in that edition run from 1.412 to 14.3; higher is better.
Position 27th of 193 · derived.
PISA Mathematics PerformanceOECD · 2022 · world median 442.09489.49442.09▲ Improved since 2012
Belgium: 489.49 · world median 442.09 · Mean mathematics score. OECD, 2022 edition, data for 2022.
Published values in that edition run from 336.4 to 574.66; higher is better.
Position 12th of 79 · derived.
Minimum Proficiency in Reading, End of PrimaryUIS · 2023 · world median 60.0894.3160.08No earlier reading
Belgium: 94.31 · world median 60.08 · Pupils at the end of primary reaching minimum proficiency in reading (%). UNESCO Institute for Statistics (UIS), 2023 edition, data for 2023.
Published values in that edition run from 2 to 98.78; higher is better.
Minimum Proficiency in Mathematics, End of Lower SecondaryUIS · 2023 · world median 48.975.0548.9No earlier reading
Belgium: 75.05 · world median 48.9 · Students at the end of lower secondary reaching minimum proficiency in mathematics (%). UNESCO Institute for Statistics (UIS), 2023 edition, data for 2023.
Published values in that edition run from 0.73 to 91.73; higher is better.
Minimum Proficiency in Mathematics, End of PrimaryUIS · 2023 · world median 43.873.0643.8No earlier reading
Belgium: 73.06 · world median 43.8 · Pupils at the end of primary reaching minimum proficiency in mathematics (%). UNESCO Institute for Statistics (UIS), 2023 edition, data for 2023.
Published values in that edition run from 1.8 to 93.42; higher is better.
Learning PovertyWorld Bank Group and UNESCO Institute for Statistics · 2023 · world median 34.028.52734.02No earlier reading
Belgium: 8.527 · world median 34.02 · 10-year-olds who cannot read and understand a simple text (%). World Bank Group and UNESCO Institute for Statistics, 2023 edition, data for 2023.
Published values in that edition run from 2.331 to 98.5; lower is better.
Position 100th of 125 · derived, 1st = worst.
Government Funding per Primary StudentUIS · 2022 · world median 17.8121.7917.81▼ Worsened since 2012
Belgium: 21.79 · world median 17.81 · Government funding per primary student (% of GDP per capita). UNESCO Institute for Statistics (UIS), 2022 edition, data for 2022.
Published values in that edition run from 3.771 to 34.57; higher is better.
Position 16th of 68 · derived.
PISA Reading PerformanceOECD · 2022 · world median 440.35478.85440.35No real change since 2012
Belgium: 478.85 · world median 440.35 · Mean reading score. OECD, 2022 edition, data for 2022.
Published values in that edition run from 328.84 to 542.55; higher is better.
Position 23rd of 79 · derived.
PISA Science PerformanceOECD · 2022 · world median 446.93490.58446.93▲ Improved since 2012
Belgium: 490.58 · world median 446.93 · Mean science score. OECD, 2022 edition, data for 2022.
Published values in that edition run from 347.1 to 561.43; higher is better.
Position 24th of 79 · derived.
Minimum Proficiency in Reading, End of Lower SecondaryUIS · 2022 · world median 58.5974.7358.59No earlier reading
Belgium: 74.73 · world median 58.59 · Students at the end of lower secondary reaching minimum proficiency in reading (%). UNESCO Institute for Statistics (UIS), 2022 edition, data for 2022.
Published values in that edition run from 5.043 to 88.83; higher is better.
Primary Completion RateUIS · 2025 · world median 97.4398.9497.43▼ Worsened since 2015
Belgium: 98.94 · world median 97.43 · Primary completion rate (%). UNESCO Institute for Statistics (UIS), 2025 edition, data for 2025.
Published values in that edition run from 7.94 to 100; higher is better.
Position 60th of 165 · derived.
Upper Secondary AttainmentUIS · 2023 · world median 65.7674.4265.76▲ Improved since 2013
Belgium: 74.42 · world median 65.76 · Adults 25+ who completed upper secondary or higher (%). UNESCO Institute for Statistics (UIS), 2023 edition, data for 2023.
Published values in that edition run from 5.26 to 97.89; higher is better.
Position 38th of 95 · derived.
Lower Secondary Completion RateUIS · 2025 · world median 89.2191.6989.21▼ Worsened since 2015
Belgium: 91.69 · world median 89.21 · Lower secondary completion rate (%). UNESCO Institute for Statistics (UIS), 2025 edition, data for 2025.
Published values in that edition run from 13.73 to 100; higher is better.
Position 75th of 164 · derived.
Behind the world median1
Statistics on which Belgium does worse than the middle country measured.
Intergenerational Persistence in EducationWorld Bank Group · 2017 · world median 0.4460.4630.446No earlier reading
Belgium: 0.463 · world median 0.446 · Correlation between own and parents' years of schooling, born 1980–89 (0–1). World Bank Group, 2017 edition, data for 2017.
Published values in that edition run from 0.123 to 0.66; lower is better.
Position 69th of 153 · derived, 1st = worst.
No better end7
These describe the shape of a country — more is not better or worse, only different — so they are never ahead or behind.
Trust in ScientistsWellcome Trust · 2020 · world median 34.3572.3534.35No real change since 2018
Belgium: 72.35 · world median 34.35 · People aged 15+ who trust scientists in their country 'a lot' (%). Wellcome Trust, 2020 edition, data for 2020.
Published values in that edition run from 9.335 to 72.35.
Scholarly ArticlesOurResearch · 2025 · world median 2,24040,5252,240No real change since 2022
Belgium: 40,525 · world median 2,240 · Articles with at least one author at an institution in the country (full counting). OpenAlex (OurResearch), 2025 edition, data for 2025.
Published values in that edition run from 1 to 1,094,890.
Nobel Prize Laureates by Country of BirthNobel Prize Outreach · 2025 · world median 292No earlier reading
Belgium: 9 · world median 2 · Laureates born in the country, 1901 to date (people). Nobel Prize Outreach, 2025 edition, data for 2025.
Published values in that edition run from 1 to 296.
Female Share of ResearchersUIS · 2024 · world median 38.1735.9338.17No earlier reading
Belgium: 35.93 · world median 38.17 · Researchers who are women (% of headcount; 50 = parity). UNESCO Institute for Statistics (UIS), 2024 edition, data for 2024.
Published values in that edition run from 0 to 76.54.
Outbound Mobility Ratio, TertiaryUIS · 2023 · world median 5.2793.2345.279No real change since 2013
Belgium: 3.234 · world median 5.279 · Outbound mobility ratio, tertiary (% of tertiary enrolment at home). UNESCO Institute for Statistics (UIS), 2023 edition, data for 2023.
Published values in that edition run from 0.333 to 1,724.
Female Share of STEM GraduatesUIS · 2023 · world median 35.328.6535.3Moved since 2014
Belgium: 28.65 · world median 35.3 · STEM graduates who are women (%; 50 = parity). UNESCO Institute for Statistics (UIS), 2023 edition, data for 2023.
Published values in that edition run from 8.333 to 55.96.
Share of Graduates from ICT ProgrammesUIS · 2023 · world median 5.6013.0195.601Moved since 2014
Belgium: 3.019 · world median 5.601 · Tertiary graduates from ICT programmes (% of all graduates). UNESCO Institute for Statistics (UIS), 2023 edition, data for 2023.
Published values in that edition run from 0 to 17.19.
No current reading for Belgium
Adult Literacy Rate, Gender Parity Index, Tertiary Enrolment (last 2023), Government Spending on Education (last 2022), Inbound Mobility Rate, Tertiary (last 2023), Out-of-School Rate, Lower Secondary Age (last 2023), Out-of-School Rate, Primary (last 2023), Participation in Organised Learning One Year Before Primary (last 2023), Pre-Primary Net Enrolment Rate (last 2023), Primary Schools with Electricity (last 2022), Primary Schools with Internet for Teaching (last 2022), Pupils per Qualified Teacher, Primary, Qualified Teachers in Primary Education, School Life Expectancy (last 2023), Secondary School Enrolment (last 2023), Tertiary Enrolment Ratio (last 2023), Wealth Parity Index, Lower Secondary Completion and Youth Literacy Rate. Listed rather than hidden, so the page can be checked against it.
“Position · derived” is this site’s ordering of the published values, 1st = best unless the row says otherwise; the publisher ranks no country on it. Rank, position and standing
05Country Index 2026
Education & Knowledge among Belgium’s 16 topics
Education & Knowledge is Belgium’s 9th best-placed topic of 16. Strongest first, each marker at its share of that topic’s field.
- Development & Human Capital7th of 1963/3 keys
- Poverty & Inequality6th of 1593/3 keys
- Gender & Equality7th of 1834/4 keys
- Economy & Innovation9th of 1764/4 keys
- Democracy & Civil Liberties21st of 1984/4 keys
- Mobility & Trade22nd of 1774/4 keys
- Health & Wellbeing26th of 2004/4 keys
- Governance & Institutions28th of 1944/4 keys
- Education & Knowledge29th of 1983/4 keys
- Food & Agriculture30th of 1844/4 keys
- Risk & Resiliencejoint 35th of 1934/4 keys
- Energy32nd of 1653/3 keys
- Digital & Technology39th of 1984/4 keys
- Peace & Securityjoint 46th of 1774/4 keys
- Work & Labourjoint 54th of 1824/4 keys
- Environment & Sustainability155th of 1864/4 keys
06The top of the list
Who leads on education & knowledge
The three countries placed highest of 198, and the leaders Belgium can most readily be measured against.
 1
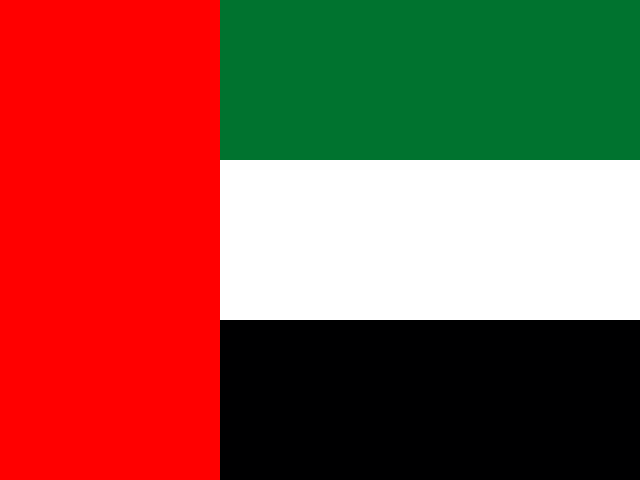 United Arab Emirates
Western Asia
1st of 198 · 2 of 4 keys
Photo: Unknown author · CC BY-SA 3.0, greyscale
 2
 Greece
Southern Europe
2nd of 198 · 3 of 4 keys
Photo: User:Ggia derivative work: Jjtkk · CC BY-SA 3.0, greyscale
 3
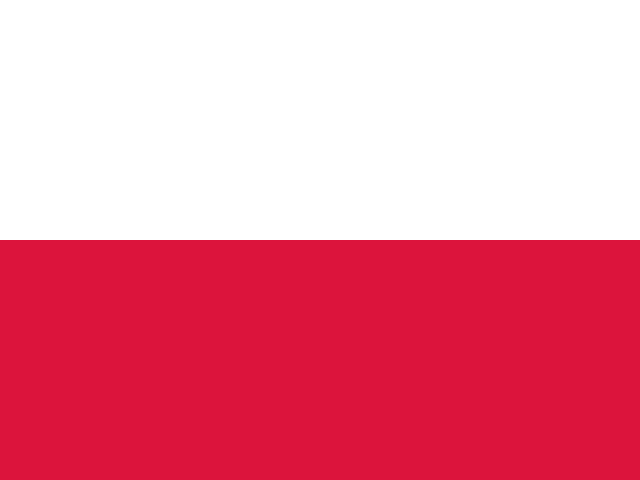 Poland
Eastern Europe
3rd of 198 · 3 of 4 keys
Photo: Ralf Lotys (Sicherlich) · CC BY 3.0, greyscale
Placed highest nearby
Highest placed on all 4 keys
 Moldova7th4/4 keys
Highest in Europe
Greece2nd3/4 keysHighest in Western Europe
 Switzerland9th3/4 keys
This page
Belgium29th3/4 keys
Positions out of 198 placed on the topic. A country needs readings on enough keys to be placed, and the top of the list is often held on fewer of them.
07Questions
Belgium on education & knowledge: questions answered
Every answer is built from the numbers on this page, so none can say something the page does not.
How does Belgium rank on education & knowledge?
Belgium is placed 29th of 198 countries on Education & Knowledge in the Country Index 2026, from 3 of its 4 key statistics (Out-of-School Rate, Primary, Participation in Organised Learning One Year Before Primary and Upper Secondary Completion Rate). The position is this site’s ordering of published statistics, not a rank any publisher printed.
What is the latest Out-of-School Rate, Primary figure for Belgium?
1.658 in 2024 (out-of-school rate, primary age (%)), according to UNESCO Institute for Statistics (UIS). The world median in the same edition was 3.691.
What is the latest Participation in Organised Learning One Year Before Primary figure for Belgium?
98.31 in 2024 (children one year before primary entry age in organised learning (%)), according to UNESCO Institute for Statistics (UIS). The world median in the same edition was 85.9.
How does Belgium compare with Germany on education & knowledge?
Germany is placed joint 19th of 198, and Belgium 29th. Out-of-School Rate, Primary: Germany 0.274, Belgium 1.658; Participation in Organised Learning One Year Before Primary: Germany 98.37, Belgium 98.31; Upper Secondary Completion Rate: Germany 80.95, Belgium 86.34.
How have Belgium’s education & knowledge figures changed?
Out-of-School Rate, Primary rose from 0.117 in 2001 to 1.658 in 2023; Participation in Organised Learning One Year Before Primary fell from 99.91 in 2001 to 98.31 in 2023; Upper Secondary Completion Rate rose from 78.88 in 2000 to 86.34 in 2025; Government Spending on Education rose from 5.796 in 2005 to 6.276 in 2022.
Which education & knowledge statistics are missing for Belgium?
No current reading is published for Belgium on Adult Literacy Rate, Gender Parity Index, Tertiary Enrolment, Government Spending on Education, Inbound Mobility Rate, Tertiary, Out-of-School Rate, Lower Secondary Age, Out-of-School Rate, Primary, Participation in Organised Learning One Year Before Primary, Pre-Primary Net Enrolment Rate, Primary Schools with Electricity, Primary Schools with Internet for Teaching, Pupils per Qualified Teacher, Primary, Qualified Teachers in Primary Education, School Life Expectancy, Secondary School Enrolment, Tertiary Enrolment Ratio, Wealth Parity Index, Lower Secondary Completion and Youth Literacy Rate. They are listed rather than hidden, so the evidence on the page can be checked against it.
08Method
Method, sources and how to cite
What this topic does not measure
How much children actually learn is only partly covered. International test scores exist for a limited group of countries, and they are published here as context rather than used as a key, because a key must describe most of the world. Universities, research, and youth and adult literacy also appear as context.
How the Education & Knowledge standing is decided
A standing is this site’s ordering, named with its edition — never a publisher’s rank. 4 key statistics vote, one vote each; every country’s published value becomes a place within that key’s own field, the places are averaged, and the average is never published. A country needs 2 of the 4 keys to be placed.
The education & knowledge method, step by stepHow every standing on this site is built
The key statistics and their licences
- Out-of-School Rate, Primary — UNESCO Institute for Statistics (UIS), CC BY-SA 4.0
- Participation in Organised Learning One Year Before Primary — UNESCO Institute for Statistics (UIS), CC BY-SA 4.0
- Upper Secondary Completion Rate — UNESCO Institute for Statistics (UIS), CC BY-SA 4.0
- Government Spending on Education — UNESCO Institute for Statistics (UIS), CC BY-SA 4.0
The other 28 statistics on this page come from 9 publishers, each named beside its numbers, with every edition and licence on the datasets pages.
The standing itself is part of the Country Index 2026, published under CC BY-SA 4.0.
Photographs
Belgium’s banner and the countries placed highest, from their profiles: Wikimedia Commons, shown in greyscale, each used under the licence named.
- Belgium (banner) — Gf uip, CC BY-SA 3.0
- United Arab Emirates — Unknown author, CC BY-SA 3.0
- Greece — User:Ggia derivative work: Jjtkk, CC BY-SA 3.0
- Poland — Ralf Lotys (Sicherlich), CC BY 3.0
Cite this page
Nations Inquiry (2026). Belgium: Education & Knowledge — standing and statistics, Country Index 2026. https://nationsinquiry.com/countries/belgium/education