Data for 2020
Bachelor's or Higher Attainment, 2020
Figures for 2020, as UIS published them · stored as published, never rewritten
This is the share of adults aged 25 and over who hold at least a bachelor's degree or its equivalent. It describes how far a country's adult population went in education, one rung above upper secondary attainment on the same ladder.
Bachelor's or Higher Attainment, 2020 covers 89 countries on 3 measures. Switzerland is highest, at 40.41; Sri Lanka is lowest, at 0.69. The middle country reads 20.98. Against 2019, 69 values changed (54 up, 15 down), 20 countries joined, 44 left.
Bachelor's or Higher Attainment · Data for 2020
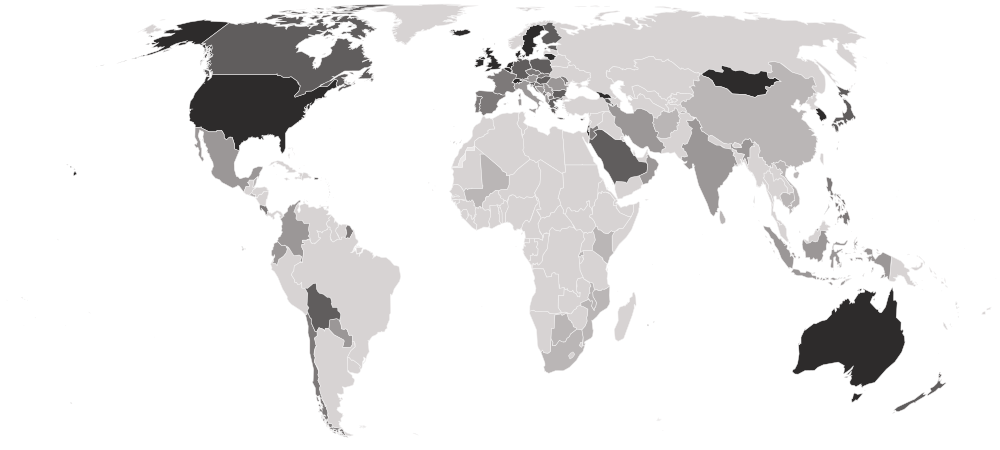

HighestSwitzerland
40.41
LowestSri Lanka
0.69Shaded by value in five groups of equal size, darkest at the better end.
01Position · derived
The table
Every country and every column of Bachelor's or Higher Attainment, 2020, as published. UIS ranks nobody on this measure; the position is derived here by ordering the published values. “=” marks a shared position.
Showing 25 of 89 countries · select a heading to sort
| derived | |||||
|---|---|---|---|---|---|
| 1 | SwitzerlandCHEWestern Europe | 40.41 | 35.240 | 45.742 | UIS based on CHE - LFS - Labour Force Survey: ILO Harmonized Microdata, https://ilostat.ilo.org/ | Age coverage - minimum age: 15 years old | Age coverage - maximum age: None |
| 2 |  Lithuania LTUNorthern Europe | 38.10 | 41.393 | 34.140 | Source: Labour Force Survey |
| 3 |  United States USANorthern America | 37.52 | 38.320 | 36.669 | Source: March 2020 Supplement of the Current Population Survey (CPS) |
| 4 |  United Kingdom GBRNorthern Europe | 37.28 | 38.787 | 35.708 | Qualifier: Proportion of population with unknown educational attainment greater than 5%. Source: Labour Force Survey |
| 5 |  Ireland IRLNorthern Europe | 37.22 | 38.925 | 35.432 | UIS based on IRL - LFS - EU Labour Force Survey: ILO Harmonized Microdata, https://ilostat.ilo.org/ | Age coverage - minimum age: 15 years old | Age coverage - maximum age: None |
| 6 |  Luxembourg LUXWestern Europe | 37.12 | 35.767 | 38.463 | UIS based on LUX - LFS - EU Labour Force Survey: ILO Harmonized Microdata, https://ilostat.ilo.org/ | Age coverage - minimum age: 15 years old | Age coverage - maximum age: None |
| 7 |  Iceland ISLNorthern Europe | 36.62 | 41.949 | 31.650 | Qualifier: Data for population 25 to 74 years. Source: Labour force survey |
| 8 |  Israel ISRWestern Asia | 36.51 | 39.715 | 33.097 | UIS based on ISR - LFS - Labour Force Survey: ILO Harmonized Microdata, https://ilostat.ilo.org/ | Age coverage - minimum age: 15 years old | Age coverage - maximum age: None |
| 9 |  Belgium BELWestern Europe | 35.47 | 37.808 | 33.025 | UIS based on BEL - LFS - EU Labour Force Survey: ILO Harmonized Microdata, https://ilostat.ilo.org/ | Age coverage - minimum age: 15 years old | Age coverage - maximum age: None |
| 10 |  Australia AUSAustralia and New Zealand | 35.02 | 38.294 | 31.622 | Qualifier: Data for population 25 to 74 years. Source: Survey of Education and Work (May 2020) |
| 11 |  Netherlands NLDWestern Europe | 34.77 | 33.339 | 36.257 | Source: Labour Force Survey |
| 12 |  South Korea KOREastern Asia | 33.87 | 28.658 | 39.210 | UIS based on KOR - LFS - Economically Active Population Survey: ILO Harmonized Microdata, https://ilostat.ilo.org/ | Age coverage - minimum age: 15 years old | Age coverage - maximum age: None |
| 13 |  Georgia GEOWestern Asia | 33.16 | 34.305 | 31.809 | UIS based on GEO - LFS - Labour Force Survey: ILO Harmonized Microdata, https://ilostat.ilo.org/ | Age coverage - minimum age: 15 years old | Age coverage - maximum age: None |
| 14 |  Denmark DNKNorthern Europe | 33.09 | 37.948 | 28.235 | Qualifier: Data for population 25 to 74 years. Source: Labour force survey |
| 15 |  Singapore SGPSouth-eastern Asia | 32.98 | 31.733 | 34.357 | Source: Census |
| 16 |  Mongolia MNGEastern Asia | 32.60 | 37.494 | 27.248 | Source: Population and Housing Census |
| 17 |  Sweden SWENorthern Europe | 32.54 | — | 27.007 | UIS based on SWE - LFS - EU Labour Force Survey: ILO Harmonized Microdata, https://ilostat.ilo.org/ | Age coverage - minimum age: 15 years old | Age coverage - maximum age: None |
| 18 |  New Zealand NZLAustralia and New Zealand | 32.28 | 35.555 | 28.849 | Source: HLFS is a quarterly survey (the estimates are an average of the 4 quarters in 2020) |
| 19 |  Saudi Arabia SAUWestern Asia | 31.05 | 32.261 | 30.294 | Source: Labour Force Survey |
| 20 |  Canada CANNorthern America | 30.97 | 32.290 | 29.598 | UIS based on CAN - LFS - Labour Force Survey: ILO Harmonized Microdata, https://ilostat.ilo.org/ | Age coverage - minimum age: 15 years old | Age coverage - maximum age: None |
| 21 |  Estonia ESTNorthern Europe | 30.85 | 34.319 | 26.734 | Source: Survey of Statistical activity 30101 'Population' |
| 22 |  Finland FINNorthern Europe | 30.29 | 32.363 | 28.126 | UIS based on FIN - LFS - EU Labour Force Survey: ILO Harmonized Microdata, https://ilostat.ilo.org/ | Age coverage - minimum age: 15 years old | Age coverage - maximum age: None |
| 23 |  Curaçao CUWCaribbean | 30.17 | 30.820 | 29.319 | Qualifier: Proportion of population with unknown educational attainment greater than 5%. Source: Census |
| 24 |  Cyprus CYPWestern Asia | 29.80 | 30.502 | 29.040 | Source: Labour Force Survey |
| 25 |  Germany DEUWestern Europe | 28.35 | 24.234 | 32.667 | Source: Labour Force Survey (Microcensus) |
| 26 |  Poland POLEastern Europe | 28.01 | 31.163 | 24.497 | Source: Labour Force Survey |
| 27 |  Puerto Rico PRICaribbean | 27.59 | 31.867 | 22.591 | UIS based on PRI - PC - Population Census: ILO Harmonized Microdata, https://ilostat.ilo.org/ | Age coverage - minimum age: 15 years old | Age coverage - maximum age: None |
| 28 |  Bolivia BOLSouth America | 26.82 | 25.588 | 28.166 | Source: Household Survey |
| 29 |  Bulgaria BGREastern Europe | 26.05 | 29.616 | 22.118 | Source: Labour Force Survey |
| 30 |  Greece GRCSouthern Europe | 26.04 | 25.381 | 26.763 | Source: Labour Force Survey |
| 31 |  Montserrat MSRCaribbean | 25.82 | 30.075 | 21.472 | UIS based on MSR - LFS - Labour Force Survey: ILO Harmonized Microdata, https://ilostat.ilo.org/ | Age coverage - minimum age: 15 years old | Age coverage - maximum age: None |
| 32 |  Japan JPNEastern Asia | 25.54 | 16.974 | 35.004 | Qualifier: Proportion of population with unknown educational attainment greater than 5%. Source: Census |
| 33 |  Armenia ARMWestern Asia | 24.21 | 23.836 | 24.673 | Source: Estimated data, based on educational attainment by Population census results and permanent population as of 01.01.2020 |
| 34 |  Hungary HUNEastern Europe | 24.08 | 25.619 | 22.330 | Source: Labour Force Survey |
| 35 |  Slovenia SVNSouthern Europe | 23.75 | 26.882 | 20.597 | UIS based on SVN - LFS - Labour Force Survey: ILO Harmonized Microdata, https://ilostat.ilo.org/ | Age coverage - minimum age: 15 years old | Age coverage - maximum age: None |
| 36 |  Slovakia SVKEastern Europe | 23.62 | 25.977 | 21.065 | UIS based on SVK - LFS - Labour Force Survey: ILO Harmonized Microdata, https://ilostat.ilo.org/ | Age coverage - minimum age: 15 years old | Age coverage - maximum age: None |
| 37 |  Spain ESPSouthern Europe | 23.58 | 25.550 | 21.466 | Source: Labour Force Survey |
| 38 |  Bahrain BHRWestern Asia | 23.33 | 26.664 | 21.727 | Source: Census |
| 39 |  Portugal PRTSouthern Europe | 22.51 | 25.421 | 19.074 | Source: Labour Force Survey |
| 40 |  Malta MLTSouthern Europe | 21.84 | 21.901 | 21.785 | Source: Labour Force Survey |
| 41 |  Palestine PSEWestern Asia | 21.71 | 23.056 | 20.384 | Source: Labour Force Survey |
| 42 |  North Macedonia MKDSouthern Europe | 21.68 | 22.480 | 20.865 | Source: Survey |
| 43 |  Costa Rica CRICentral America | 21.61 | 22.529 | 20.542 | Source: National Household Survey (Encuesta Nacional de Hogares) |
| 44 |  Czechia CZEEastern Europe | 21.39 | 21.771 | 20.977 | UIS based on CZE - LFS - Labour Force Sample Survey: ILO Harmonized Microdata, https://ilostat.ilo.org/ | Age coverage - minimum age: 15 years old | Age coverage - maximum age: None |
| 45 |  France FRAWestern Europe | 20.98 | 20.803 | 21.175 | UIS based on FRA - LFS - Employment Survey: ILO Harmonized Microdata, https://ilostat.ilo.org/ | Age coverage - minimum age: 15 years old | Age coverage - maximum age: None |
| 46 |  Philippines PHLSouth-eastern Asia | 20.34 | 22.649 | 18.031 | Source: Population Census |
| 47 |  Moldova MDAEastern Europe | 20.19 | 22.160 | 17.880 | Source: Labour Force Survey |
| 48 |  Cook Islands COKPolynesia | 19.62 | 21.467 | 17.690 | Source: Cook Islands Labour Force Survey 2019-20. |
| 49 |  Montenegro MNESouthern Europe | 19.58 | 20.432 | 18.664 | UIS based on MNE - LFS - Labour Force Survey: ILO Harmonized Microdata, https://ilostat.ilo.org/ | Age coverage - minimum age: 15 years old | Age coverage - maximum age: None |
| 50 |  Chile CHLSouth America | 19.17 | 18.622 | 19.757 | UIS based on CHL - LFS - National Employment Survey: ILO Harmonized Microdata, https://ilostat.ilo.org/ | Age coverage - minimum age: 15 years old | Age coverage - maximum age: None |
| 51 |  Croatia HRVSouthern Europe | 18.83 | 20.313 | 17.174 | UIS based on HRV - LFS - EU Labour Force Survey: ILO Harmonized Microdata, https://ilostat.ilo.org/ | Age coverage - minimum age: 15 years old | Age coverage - maximum age: None |
| 52 |  Jordan JORWestern Asia | 18.63 | 19.326 | 18.036 | UIS based on JOR - LFS - Employment and Unemployment Survey: ILO Harmonized Microdata, https://ilostat.ilo.org/ | Age coverage - minimum age: 15 years old | Age coverage - maximum age: None |
| 53 |  San Marino SMRSouthern Europe | 18.19 | 20.311 | 15.881 | Source: Public registers |
| 54 |  Albania ALBSouthern Europe | 17.80 | 18.920 | 16.646 | UIS based on ALB - LFS - Labour Force Survey: ILO Harmonized Microdata, https://ilostat.ilo.org/ | Age coverage - minimum age: 15 years old | Age coverage - maximum age: None |
| 55 |  Mexico MEXCentral America | 17.13 | 16.336 | 18.001 | Source: Census |
| 56 |  Oman OMNWestern Asia | 17.10 | 22.881 | 14.134 | Source: Census |
| 57 |  Iran IRNSouthern Asia | 16.73 | 16.068 | 17.407 | UIS based on IRN - LFS - Labour Force Survey: ILO Harmonized Microdata, https://ilostat.ilo.org/ | Age coverage - minimum age: 15 years old | Age coverage - maximum age: None |
| 58 |  Italy ITASouthern Europe | 16.55 | 17.739 | 15.242 | Source: Labour Force Survey |
| 59 |  Serbia SRBSouthern Europe | 16.29 | 17.174 | 15.315 | UIS based on SRB - LFS - Labour Force Survey: ILO Harmonized Microdata, https://ilostat.ilo.org/ | Age coverage - minimum age: 15 years old | Age coverage - maximum age: None |
| 60 |  Austria AUTWestern Europe | 15.97 | 15.957 | 15.983 | UIS based on AUT - LFS - Labour Force Survey: ILO Harmonized Microdata, https://ilostat.ilo.org/ | Age coverage - minimum age: 15 years old | Age coverage - maximum age: None |
| 61 |  Brunei BRNSouth-eastern Asia | 15.48 | 18.413 | 12.915 | UIS based on BRN - LFS - Labour Force Survey: ILO Harmonized Microdata, https://ilostat.ilo.org/ | Age coverage - minimum age: 15 years old | Age coverage - maximum age: None |
| 62 |  Romania ROUEastern Europe | 15.14 | 15.251 | 15.016 | UIS based on ROU - LFS - Household Labour Force Survey: ILO Harmonized Microdata, https://ilostat.ilo.org/ | Age coverage - minimum age: 15 years old | Age coverage - maximum age: None |
| 63 |  Palau PLWMicronesia | 14.69 | 17.487 | 12.384 | UIS based on PLW - PC - Population Census: ILO Harmonized Microdata, https://ilostat.ilo.org/ | Age coverage - minimum age: 15 years old | Age coverage - maximum age: None |
| 64 |  Paraguay PRYSouth America | 14.19 | 16.533 | 11.727 | Source: Survey of life conditions |
| 65 |  Colombia COLSouth America | 12.85 | 13.536 | 12.101 | Source: Great Integrated Household Survey GEIH |
| 66 |  India INDSouthern Asia | 12.22 | 9.880 | 14.619 | Source: Periodic Labour Force Survey 2019-20 |
| 67 |  Ecuador ECUSouth America | 11.94 | 12.884 | 10.885 | Source: National Survey of Employment, Unemployment and Underemployment (ENEMDU) |
| 68 |  Mauritius MUSEastern Africa | 11.60 | 10.841 | 12.383 | UIS based on MUS - LFS - Continuous Multi-Purpose Household Survey: ILO Harmonized Microdata, https://ilostat.ilo.org/ | Age coverage - minimum age: 16 years old | Age coverage - maximum age: 64 years old |
| 69 |  Saint Lucia LCACaribbean | 11.06 | 12.341 | 9.373 | Source: Saint-Lucia STEPS Noncommunicable Disease Risk Factor Survey, 2019-20. |
| 70 |  Bosnia and Herzegovina BIHSouthern Europe | 10.59 | 10.629 | 10.548 | Source: Labour Force Survey |
| 71 |  Indonesia IDNSouth-eastern Asia | 10.52 | 10.558 | 10.475 | Source: National Socio-Economic Survey |
| 72 |  Vietnam VNMSouth-eastern Asia | 10.36 | 9.648 | 11.115 | UIS based on VNM - LFS - Labour Force Survey: ILO Harmonized Microdata, https://ilostat.ilo.org/ | Age coverage - minimum age: 15 years old | Age coverage - maximum age: None |
| 73 |  El Salvador SLVCentral America | 8.43 | 7.645 | 9.406 | Source: Multiple purposes household survey |
| 74 |  Belize BLZCentral America | 7.88 | 9.062 | 6.701 | Source: Labour Force Survey |
| 75 |  China CHNEastern Asia | 7.68 | 7.402 | 7.949 | Source: Census |
| 76 |  South Africa ZAFSouthern Africa | 6.64 | 6.845 | 6.395 | Source: South Africa General Household Survey 2020. |
| 77 |  Botswana BWASouthern Africa | 6.62 | 5.868 | 7.564 | Source: Botswana Quarterly Multi-Topic Survey, Quarter 4 2020. |
| 78 |  Grenada GRDCaribbean | 6.04 | 6.308 | 5.712 | UIS based on GRD - LFS - Labour Force Survey: ILO Harmonized Microdata, https://ilostat.ilo.org/ | Age coverage - minimum age: 15 years old | Age coverage - maximum age: None |
| 79 |  Cambodia KHMSouth-eastern Asia | 5.94 | 4.080 | 8.046 | UIS based on KHM - HIES - Household Socio-Economic Survey: ILO Harmonized Microdata, https://ilostat.ilo.org/ | Age coverage - minimum age: 15 years old | Age coverage - maximum age: None |
| 80 |  Kenya KENEastern Africa | 3.74 | 2.782 | 4.835 | Source: Kenya Continuous Household Survey Programme (KCHSP) 2020. |
| 81 |  Afghanistan AFGSouthern Asia | 3.72 | 1.082 | 6.286 | UIS based on AFG - LFS - Labour Force Survey: ILO Harmonized Microdata, https://ilostat.ilo.org/ | Age coverage - minimum age: 15 years old | Age coverage - maximum age: None |
| 82 |  Mozambique MOZEastern Africa | 3.32 | 2.627 | 3.904 | Source: Budget Survey of Family (IOF) |
| 83 |  Rwanda RWAEastern Africa | 3.31 | 2.725 | 4.082 | Source: Rwanda DHS 2019-20. |
| 84 |  Vanuatu VUTMelanesia | 2.58 | 2.037 | 3.143 | UIS based on VUT - PC - Population and Housing Census: ILO Harmonized Microdata, https://ilostat.ilo.org/ | Age coverage - minimum age: 15 years old | Age coverage - maximum age: None |
| 85 |  Kiribati KIRMicronesia | 1.99 | 1.935 | 2.052 | UIS based on KIR - PC - Population Census: ILO Harmonized Microdata, https://ilostat.ilo.org/ | Age coverage - minimum age: 15 years old | Age coverage - maximum age: None |
| 86 |  Gambia GMBWestern Africa | 1.88 | 0.867 | 3.204 | Source: Gambia DHS 2019-20. |
| 87 |  Mali MLIWestern Africa | 1.56 | 0.804 | 2.384 | Source: MODULAR AND PERMANENT HOUSEHOLD SURVEY (EMOP) |
| 88 |  Malawi MWIEastern Africa | 1.32 | 0.619 | 2.168 | Source: Malawi MICS 2019-20. |
| 89 | Sri LankaLKASouthern Asia | 0.69 | 0.629 | 0.767 | UIS based on LKA - LFS - Labour Force Survey: ILO Harmonized Microdata, https://ilostat.ilo.org/ | Age coverage - minimum age: 15 years old | Age coverage - maximum age: None |
02In 2020
At either end
The 5 countries at each end of the headline, then the highest and lowest on each other measure.
Highest
- 1Switzerland40.41
- 2Lithuania38.10
- 3United States37.52
- 4United Kingdom37.28
- 5Ireland37.22
A higher value is the better result. The middle country reads 20.98. “Shared” marks a value another country also holds.
Each measure’s ends
Female
Highest
Iceland41.949Lowest
Malawi0.619Middle country: 21.836
Male
Highest
Switzerland45.742Lowest
Sri Lanka0.767Middle country: 19.757
032019 → 2020
Since 2019
- +20 / −44countries joined / left
- 69values changed, of 69 in both
- 54 · 15rose · fell
- 0unchanged
Rose most
- Sweden25.08 → 32.54+7.46
- Saudi Arabia24.54 → 31.05+6.51
- Cambodia0.11 → 5.94+5.83
- Finland25.94 → 30.29+4.35
- North Macedonia17.54 → 21.68+4.14
Fell most
- Philippines24.41 → 20.34−4.07
- Armenia27.49 → 24.21−3.28
- Rwanda6.02 → 3.31−2.71
- Cook Islands21.83 → 19.62−2.21
- Kiribati4.06 → 1.99−2.07
+ Afghanistan+ Bahrain+ China+ Costa Rica+ Curaçao+ Ecuador+ Estonia+ United Kingdom+ Gambia+ Japan+ Saint Lucia+ Mexico+ Mozambique+ Montserrat+ Malawi+ New Zealand+ Oman+ Palau+ Puerto Rico+ San Marino − United Arab Emirates
 − Azerbaijan
 − Benin
 − Burkina Faso
 − Bangladesh
 − Bahamas
 − Belarus
 − Central African Republic
 − Cuba
 − Dominican Republic
 − Algeria
 − Ethiopia
 − Guatemala
 − Guyana
 − Honduras
 − Lebanon
 − Liberia
 − Latvia
 − Maldives
 − Marshall Islands
 − Myanmar
 − Malaysia
 − New Caledonia
 − Niger
 − Nigeria
 − Norway
 − Pakistan
 − Panama
 − Senegal
 − Sierra Leone
 − São Tomé and Príncipe
 − Turks and Caicos Islands
 − Chad
 − Togo
 − Thailand
 − Turkmenistan
 − Tonga
 − Tunisia
 − Uganda
 − Ukraine
 − Uruguay
 − Uzbekistan
 − Samoa
 − Zimbabwe
Changes in value, not in places: a country’s place also moves when others do.
04Caveats
Read before you use
1 empty cell
An empty cell means the publisher gave no figure. It is never a zero.
05The files
Download and cite
- .csv
For a spreadsheet or code
89 rows · 16 KB · UTF-8, opens in Excel
Opens with 11 lines of source notes; the table starts on row 13.
Download bachelors-attainment-2020-nations-inquiry.csv - ↗
The publisher’s original
UIS’s own file, on its own site.
indicators
What this site changed: Reshaped to one row per country, with its ISO code; no value recalculated, rescaled or rounded. In full
Licence: CC BY-SA 4.0 · what it allows, in plain words
Cite this edition
UNESCO Institute for Statistics (UIS) (2020). Bachelor's or Higher Attainment, 2020 [data set], describing 2020. As held by Nations Inquiry, https://nationsinquiry.com/datasets/bachelors-attainment/2020
0611 held
Other years
‹ The year before
Bachelor's or Higher Attainment, 2019113 countries
The year after ›
Bachelor's or Higher Attainment, 202184 countries
All of them
Bachelor's or Higher Attainment: every year11 held, with the data dictionary, coverage and licence.
How it has moved, charted by country