Data for 2018
Bachelor's or Higher Attainment, 2018
Figures for 2018, as UIS published them · stored as published, never rewritten
This is the share of adults aged 25 and over who hold at least a bachelor's degree or its equivalent. It describes how far a country's adult population went in education, one rung above upper secondary attainment on the same ladder.
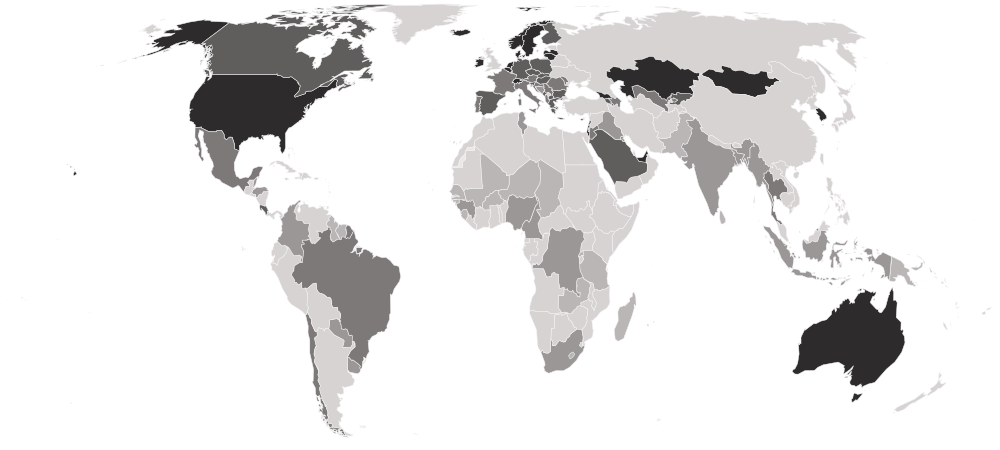
Bachelor's or Higher Attainment, 2018 covers 101 countries on 3 measures. United Arab Emirates is highest, at 47.293; Sri Lanka is lowest, at 0.684. The middle country reads 16.303. Against 2017, 68 values changed (54 up, 14 down), 33 countries joined, 28 left.
Bachelor's or Higher Attainment · Data for 2018
HighestUnited Arab Emirates
47.293
LowestSri Lanka
0.684Shaded by value in five groups of equal size, darkest at the better end.
01Position · derived
The table
Every country and every column of Bachelor's or Higher Attainment, 2018, as published. UIS ranks nobody on this measure; the position is derived here by ordering the published values. “=” marks a shared position.
Showing 25 of 101 countries · select a heading to sort
| derived | |||||
|---|---|---|---|---|---|
| 1 | United Arab EmiratesAREWestern Asia | 47.293 | 45.2064 | 48.03 | Source: Labour Force Survey |
| 2 |  Iceland ISLNorthern Europe | 39.039 | 46.5323 | 31.97 | UIS based on ISL - LFS - EU Labour Force Survey: ILO Harmonized Microdata, https://ilostat.ilo.org/ | Age coverage - minimum age: 15 years old | Age coverage - maximum age: None |
| 3 |  Switzerland CHEWestern Europe | 38.985 | 32.8689 | 45.34 | UIS based on CHE - LFS - Labour Force Survey: ILO Harmonized Microdata, https://ilostat.ilo.org/ | Age coverage - minimum age: 15 years old | Age coverage - maximum age: None |
| 4 |  Lithuania LTUNorthern Europe | 35.952 | 39.6863 | 31.32 | UIS based on LTU - LFS - EU Labour Force Survey: ILO Harmonized Microdata, https://ilostat.ilo.org/ | Age coverage - minimum age: 15 years old | Age coverage - maximum age: None |
| 5 |  Israel ISRWestern Asia | 35.798 | 38.4653 | 32.94 | UIS based on ISR - LFS - Labour Force Survey: ILO Harmonized Microdata, https://ilostat.ilo.org/ | Age coverage - minimum age: 15 years old | Age coverage - maximum age: None |
| 6 |  Luxembourg LUXWestern Europe | 35.302 | 33.3395 | — | UIS based on LUX - LFS - EU Labour Force Survey: ILO Harmonized Microdata, https://ilostat.ilo.org/ | Age coverage - minimum age: 15 years old | Age coverage - maximum age: None |
| 7 |  Ireland IRLNorthern Europe | 35.153 | 37.0400 | 33.17 | UIS based on IRL - LFS - EU Labour Force Survey: ILO Harmonized Microdata, https://ilostat.ilo.org/ | Age coverage - minimum age: 15 years old | Age coverage - maximum age: None |
| 8 |  United States USANorthern America | 34.992 | 35.3172 | 34.64 | Source: October 2017 and March 2018 Supplements of the Current Population Survey (CPS) |
| 9 |  Georgia GEOWestern Asia | 34.850 | 35.1688 | 34.47 | Source: Georgia MICS 2018. |
| 10 |  Kazakhstan KAZCentral Asia | 34.081 | 35.8866 | 32.03 | Source: Sample survey of employment of the population (sample survey of households. Form T-001) |
| 11 |  Belgium BELWestern Europe | 33.789 | 35.3109 | 32.20 | UIS based on BEL - LFS - EU Labour Force Survey: ILO Harmonized Microdata, https://ilostat.ilo.org/ | Age coverage - minimum age: 15 years old | Age coverage - maximum age: None |
| 12 |  South Korea KOREastern Asia | 33.022 | 27.3533 | 38.86 | UIS based on KOR - LFS - Economically Active Population Survey: ILO Harmonized Microdata, https://ilostat.ilo.org/ | Age coverage - minimum age: 15 years old | Age coverage - maximum age: None |
| 13 |  Denmark DNKNorthern Europe | 32.359 | 37.4928 | 27.21 | Qualifier: Data for population 25 to 74 years. Source: Labour force survey |
| 14 |  Australia AUSAustralia and New Zealand | 31.749 | 34.7824 | 28.63 | Qualifier: Data for population 25 to 74 years. Source: Survey of Education and Work |
| 15 |  Singapore SGPSouth-eastern Asia | 31.596 | 29.3541 | 34.04 | Source: Labour Force Survey |
| 16 |  Netherlands NLDWestern Europe | 31.093 | 29.5241 | 32.72 | Source: Labour Force Survey |
| 17 |  Sweden SWENorthern Europe | 30.992 | — | 25.78 | UIS based on SWE - LFS - EU Labour Force Survey: ILO Harmonized Microdata, https://ilostat.ilo.org/ | Age coverage - minimum age: 15 years old | Age coverage - maximum age: None |
| 18 |  Norway NORNorthern Europe | 30.448 | 35.8160 | 25.27 | UIS based on NOR - LFS - EU Labour Force Survey: ILO Harmonized Microdata, https://ilostat.ilo.org/ | Age coverage - minimum age: 15 years old | Age coverage - maximum age: None |
| 19 |  Latvia LVANorthern Europe | 30.028 | 36.2977 | 22.81 | Qualifier: Data for population 25 to 74 years. Source: Labour force survey |
| 20 |  Mongolia MNGEastern Asia | 29.282 | 33.7750 | 24.17 | Source: Mongolia MICS 2018. |
| 21 |  Cyprus CYPWestern Asia | 28.561 | 29.0906 | 27.99 | Source: Labour Force Survey |
| 22 |  Canada CANNorthern America | 28.520 | 29.5843 | 27.41 | UIS based on CAN - LFS - Labour Force Survey: ILO Harmonized Microdata, https://ilostat.ilo.org/ | Age coverage - minimum age: 15 years old | Age coverage - maximum age: None |
| 23 |  Finland FINNorthern Europe | 28.085 | 30.1371 | 25.94 | UIS based on FIN - LFS - EU Labour Force Survey: ILO Harmonized Microdata, https://ilostat.ilo.org/ | Age coverage - minimum age: 15 years old | Age coverage - maximum age: None |
| 24 |  Poland POLEastern Europe | 26.533 | 29.4916 | 23.23 | UIS based on POL - LFS - Labour Force Survey: ILO Harmonized Microdata, https://ilostat.ilo.org/ | Age coverage - minimum age: 15 years old | Age coverage - maximum age: None |
| 25 |  Bulgaria BGREastern Europe | 25.649 | 29.3653 | 21.57 | UIS based on BGR - LFS - EU Labour Force Survey: ILO Harmonized Microdata, https://ilostat.ilo.org/ | Age coverage - minimum age: 15 years old | Age coverage - maximum age: None |
| 26 |  Lebanon LBNWestern Asia | 25.461 | 25.4050 | 25.52 | Source: Lebanon Labour Force and Household Living Conditions Survey 2018-19. Populations in refugee camps and informal settlements were excluded from the sampling frame. |
| 27 |  Germany DEUWestern Europe | 25.150 | 21.0991 | 29.36 | Source: Labour Force Survey (Microcensus) |
| 28 |  Saudi Arabia SAUWestern Asia | 24.753 | 25.2079 | 24.47 | UIS based on SAU - LFS - Labour Force Survey: ILO Harmonized Microdata, https://ilostat.ilo.org/ | Age coverage - minimum age: 15 years old | Age coverage - maximum age: None |
| 29 |  Armenia ARMWestern Asia | 24.269 | 24.9054 | 23.55 | UIS based on ARM - LFS - Household Labour Force Survey: ILO Harmonized Microdata, https://ilostat.ilo.org/ | Age coverage - minimum age: 15 years old | Age coverage - maximum age: 75 years old |
| 30 |  Kyrgyzstan KGZCentral Asia | 24.265 | 24.6006 | 23.89 | Source: Kyrgyz Republic MICS 2018. |
| 31 |  Greece GRCSouthern Europe | 24.173 | 24.1539 | 24.19 | UIS based on GRC - LFS - Labour Force Survey: ILO Harmonized Microdata, https://ilostat.ilo.org/ | Age coverage - minimum age: 15 years old | Age coverage - maximum age: None |
| 32 |  Spain ESPSouthern Europe | 21.936 | 23.6304 | 20.13 | Source: Labour Force Survey |
| 33 |  Slovakia SVKEastern Europe | 21.891 | 23.3738 | 20.28 | Source: Labour Force Survey |
| 34 |  Hungary HUNEastern Europe | 21.831 | 22.8812 | 20.64 | UIS based on HUN - LFS - Labour Force Survey: ILO Harmonized Microdata, https://ilostat.ilo.org/ | Age coverage - minimum age: 15 years old | Age coverage - maximum age: None |
| 35 |  Bahrain BHRWestern Asia | 21.605 | 28.5809 | 18.26 | Source: Administirative Records |
| 36 |  Montenegro MNESouthern Europe | 21.451 | 20.0367 | 22.96 | Source: Montenegro MICS 2018. |
| 37 |  Costa Rica CRICentral America | 21.310 | 22.3582 | 20.12 | Source: National Household Survey (Encuesta Nacional de Hogares) |
| 38 |  North Macedonia MKDSouthern Europe | 21.126 | 21.3842 | 20.86 | Source: North Macedonia MICS 2018-19. |
| 39 |  Czechia CZEEastern Europe | 21.002 | 20.9667 | 21.04 | UIS based on CZE - LFS - Labour Force Sample Survey: ILO Harmonized Microdata, https://ilostat.ilo.org/ | Age coverage - minimum age: 15 years old | Age coverage - maximum age: None |
| 40 |  Slovenia SVNSouthern Europe | 20.728 | 23.3652 | 18.01 | UIS based on SVN - LFS - Labour Force Survey: ILO Harmonized Microdata, https://ilostat.ilo.org/ | Age coverage - minimum age: 15 years old | Age coverage - maximum age: None |
| 41 |  Moldova MDAEastern Europe | 20.123 | 21.8083 | 18.16 | Source: Labour Force Survey |
| 42 |  Jordan JORWestern Asia | 19.328 | 18.9749 | 19.65 | UIS based on JOR - LFS - Employment and Unemployment Survey: ILO Harmonized Microdata, https://ilostat.ilo.org/ | Age coverage - minimum age: 15 years old | Age coverage - maximum age: None |
| 43 |  France FRAWestern Europe | 19.223 | 18.8299 | 19.66 | UIS based on FRA - LFS - Employment Survey: ILO Harmonized Microdata, https://ilostat.ilo.org/ | Age coverage - minimum age: 15 years old | Age coverage - maximum age: None |
| 44 |  Palestine PSEWestern Asia | 19.087 | 20.1010 | 18.09 | Source: Labour Force Survey |
| 45 |  Portugal PRTSouthern Europe | 18.654 | 21.4512 | 15.39 | Source: Labour Force Survey |
| 46 |  Malta MLTSouthern Europe | 18.425 | 18.2116 | 18.63 | Source: Labour Force Survey |
| 47 |  Croatia HRVSouthern Europe | 17.910 | 18.4570 | 17.30 | UIS based on HRV - LFS - EU Labour Force Survey: ILO Harmonized Microdata, https://ilostat.ilo.org/ | Age coverage - minimum age: 15 years old | Age coverage - maximum age: None |
| 48 |  Chile CHLSouth America | 17.841 | 16.7815 | 18.97 | UIS based on CHL - LFS - National Employment Survey: ILO Harmonized Microdata, https://ilostat.ilo.org/ | Age coverage - minimum age: 15 years old | Age coverage - maximum age: None |
| 49 |  Brazil BRASouth America | 16.543 | 18.2921 | 14.55 | Source: National Household Sample Survey/IBGE/PNAD Continued |
| 50 |  Albania ALBSouthern Europe | 16.468 | 17.2314 | 15.67 | UIS based on ALB - LFS - Labour Force Survey: ILO Harmonized Microdata, https://ilostat.ilo.org/ | Age coverage - minimum age: 15 years old | Age coverage - maximum age: None |
| 51 |  Uzbekistan UZBCentral Asia | 16.303 | 12.7171 | 20.00 | Source: Household sample survey |
| 52 |  Italy ITASouthern Europe | 16.179 | 17.3977 | 14.86 | UIS based on ITA - LFS - EU Labour Force Survey: ILO Harmonized Microdata, https://ilostat.ilo.org/ | Age coverage - minimum age: 15 years old | Age coverage - maximum age: None |
| 53 |  Mexico MEXCentral America | 16.016 | 14.8644 | 17.33 | Source: National Survey of Occupation and Employment(ENOE) |
| 54 |  San Marino SMRSouthern Europe | 15.760 | 17.4490 | 13.90 | Source: Public registers |
| 55 |  Azerbaijan AZEWestern Asia | 15.730 | 12.5285 | 19.19 | Source: Estimated data based on polulation census from 2009 |
| 56 |  Serbia SRBSouthern Europe | 15.488 | 16.0464 | 14.88 | UIS based on SRB - LFS - Labour Force Survey: ILO Harmonized Microdata, https://ilostat.ilo.org/ | Age coverage - minimum age: 15 years old | Age coverage - maximum age: None |
| 57 | 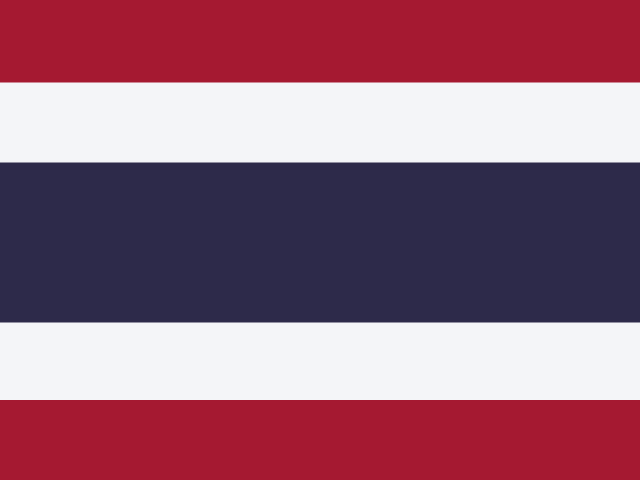 Thailand THASouth-eastern Asia | 14.939 | 16.5824 | 13.14 | Source: The 2018 (1st quarter) Household Survey on the Use of Information and Communication Technology |
| 58 | 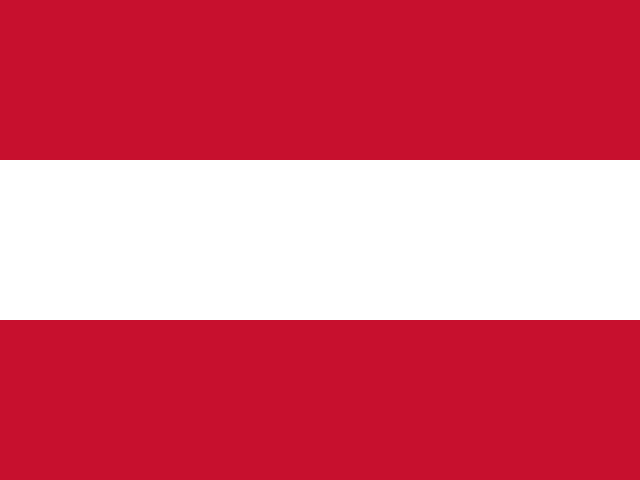 Austria AUTWestern Europe | 14.796 | 14.4709 | 15.14 | UIS based on AUT - LFS - Labour Force Survey: ILO Harmonized Microdata, https://ilostat.ilo.org/ | Age coverage - minimum age: 15 years old | Age coverage - maximum age: None |
| 59 | 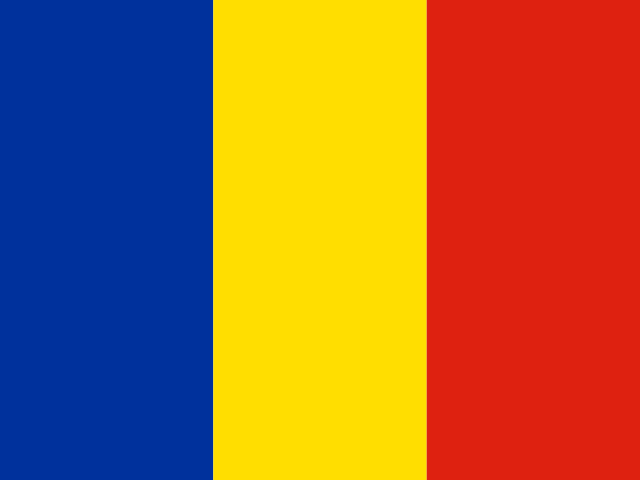 Romania ROUEastern Europe | 14.510 | 14.6358 | 14.37 | UIS based on ROU - LFS - Household Labour Force Survey: ILO Harmonized Microdata, https://ilostat.ilo.org/ | Age coverage - minimum age: 15 years old | Age coverage - maximum age: None |
| 60 | 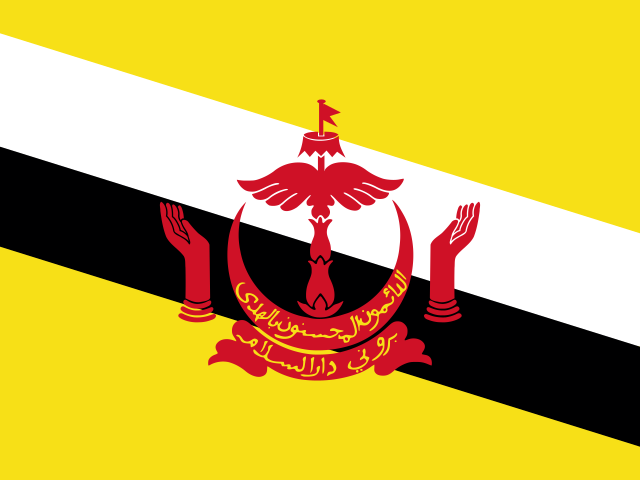 Brunei BRNSouth-eastern Asia | 14.322 | 15.8827 | 12.86 | UIS based on BRN - LFS - Labour Force Survey: ILO Harmonized Microdata, https://ilostat.ilo.org/ | Age coverage - minimum age: 15 years old | Age coverage - maximum age: None |
| 61 |  Tunisia TUNNorthern Africa | 13.398 | 13.9530 | 12.81 | Source: Tunisia MICS 2018. |
| 62 |  Paraguay PRYSouth America | 13.023 | 15.7509 | 10.21 | Source: Survey of life conditions |
| 63 |  Antigua and Barbuda ATGCaribbean | 12.277 | 13.3233 | 11.01 | UIS based on ATG - LFS - Labour Force Survey: ILO Harmonized Microdata, https://ilostat.ilo.org/ | Age coverage - minimum age: 15 years old | Age coverage - maximum age: None |
| 64 |  Colombia COLSouth America | 11.755 | 12.3360 | 11.13 | Source: Great Integrated Household Survey GEIH |
| 65 |  Uruguay URYSouth America | 11.473 | 13.8799 | 8.76 | Source: Continuous Household Survey (sample survey) and INE population projections |
| 66 |  Kuwait KWTWestern Asia | 11.116 | 15.7584 | 8.79 | Qualifier: Proportion of population with unknown educational attainment greater than 5%. Source: The Public Authority For Civil Information |
| 67 |  India INDSouthern Asia | 10.783 | 7.7867 | 13.73 | Source: National Level HH Surveys-NSS 75th round (2017-18) |
| 68 |  Iraq IRQWestern Asia | 10.407 | 7.6860 | 13.19 | Source: Iraq MICS 2018. |
| 69 |  Honduras HNDCentral America | 9.583 | 9.8951 | 9.21 | Source: Permanent Survey of Multiple Purpose Households (EPHPM) June 2018 |
| 70 |  Indonesia IDNSouth-eastern Asia | 9.374 | 9.2227 | 9.53 | Source: National Socio-Economic Survey |
| 71 |  Bangladesh BGDSouthern Asia | 9.362 | 6.3526 | 12.50 | Source: Sample Vital Registration System (SVRS), 2018, Bangladesh Bureau of Statistics (BBS) |
| 72 |  Mauritius MUSEastern Africa | 9.295 | 8.1958 | 10.47 | UIS based on MUS - LFS - Continuous Multi-Purpose Household Survey: ILO Harmonized Microdata, https://ilostat.ilo.org/ | Age coverage - minimum age: 16 years old | Age coverage - maximum age: None |
| 73 |  Belize BLZCentral America | 9.282 | 10.3478 | 8.20 | UIS based on BLZ - LFS - Labour Force Survey: ILO Harmonized Microdata, https://ilostat.ilo.org/ | Age coverage - minimum age: 15 years old | Age coverage - maximum age: None |
| 74 |  Nigeria NGAWestern Africa | 8.148 | 5.7998 | 10.61 | Source: Nigeria DHS 2018. |
| 75 |  Bosnia and Herzegovina BIHSouthern Europe | 7.748 | 7.1926 | 8.35 | Source: Labour Force Survey |
| 76 |  Myanmar MMRSouth-eastern Asia | 7.425 | 8.2201 | 6.45 | UIS based on MMR - LFS - Labour Force Survey: ILO Harmonized Microdata, https://ilostat.ilo.org/ | Age coverage - minimum age: 15 years old | Age coverage - maximum age: None |
| 77 |  DR Congo CODMiddle Africa | 7.414 | 4.4443 | 10.87 | Source: Democratic Republic of the Congo MICS 2017-18. |
| 78 |  South Africa ZAFSouthern Africa | 6.816 | 6.6537 | 6.99 | UIS based on ZAF - LFS - Quarterly Labour Force Survey: ILO Harmonized Microdata, https://ilostat.ilo.org/ | Age coverage - minimum age: 15 years old | Age coverage - maximum age: None |
| 79 |  Cameroon CMRMiddle Africa | 6.422 | 4.2849 | 8.84 | Source: Cameroon DHS 2018. |
| 80 |  Guinea GINWestern Africa | 6.207 | 2.6540 | 10.29 | Source: Harmonized Survey on Household Living Conditions (EHCVM) |
| 81 |  Grenada GRDCaribbean | 5.489 | 6.7100 | 4.36 | UIS based on GRD - LFS - Labour Force Survey: ILO Harmonized Microdata, https://ilostat.ilo.org/ | Age coverage - minimum age: 15 years old | Age coverage - maximum age: None |
| 82 |  Suriname SURSouth America | 4.951 | 5.3346 | 4.51 | Source: Suriname MICS 2018. |
| 83 |  Rwanda RWAEastern Africa | 4.133 | 3.4240 | 4.96 | Source: The Fifth Integrated Household Living Conditions Survey |
| 84 |  Guinea-Bissau GNBWestern Africa | 4.105 | 2.6177 | 5.89 | UIS based on GNB - LFS - Integrated Regional Survey on Employment and Informal Sector: ILO Harmonized Microdata, https://ilostat.ilo.org/ | Age coverage - minimum age: 15 years old | Age coverage - maximum age: None |
| 85 |  Lesotho LSOSouthern Africa | 3.938 | 4.6390 | 3.15 | Source: Lesotho MICS 2018. |
| 86 |  Pakistan PAKSouthern Asia | 3.891 | 3.1843 | 4.62 | Source: Pakistan DHS 2017-18. |
| 87 |  Tonga TONPolynesia | 3.883 | 3.1641 | 4.57 | UIS based on TON - LFS - Labour Force Survey: ILO Harmonized Microdata, https://ilostat.ilo.org/ | Age coverage - minimum age: 15 years old | Age coverage - maximum age: None |
| 88 |  Senegal SENWestern Africa | 3.166 | 1.8119 | 5.06 | Source: Senegal DHS 2018. |
| 89 |  Mali MLIWestern Africa | 3.127 | 1.3348 | 5.08 | Source: Mali DHS 2018. |
| 90 |  Guyana GUYSouth America | 3.043 | 3.2002 | — | UIS based on GUY - LFS - Labour Force Survey: ILO Harmonized Microdata, https://ilostat.ilo.org/ | Age coverage - minimum age: 15 years old | Age coverage - maximum age: None |
| 91 |  Kiribati KIRMicronesia | 2.780 | 2.6539 | 2.93 | Source: Kiribati MICS 2018-19. |
| 92 |  Madagascar MDGEastern Africa | 2.755 | 2.2504 | 3.29 | Source: Census |
| 93 |  Chad TCDMiddle Africa | 2.732 | 1.0352 | 4.67 | UIS based on TCD - HIES - Modular and Integrated Household Survey on Living Conditions: ILO Harmonized Microdata, https://ilostat.ilo.org/ | Age coverage - minimum age: 15 years old | Age coverage - maximum age: None |
| 94 |  Papua New Guinea PNGMelanesia | 2.150 | 1.2361 | 3.07 | Source: Papua New Guinea DHS 2016-18. |
| 95 |  Burkina Faso BFAWestern Africa | 2.146 | 0.7530 | 3.71 | Source: 2018 Harmonized Household Living Conditions Survey (EHCVM-2018) |
| 96 |  Sierra Leone SLEWestern Africa | 1.909 | 1.0115 | 2.95 | UIS based on SLE - HS - Integrated Household Survey: ILO Harmonized Microdata, https://ilostat.ilo.org/ | Age coverage - minimum age: 15 years old | Age coverage - maximum age: None |
| 97 |  Zambia ZMBEastern Africa | 1.815 | 1.2879 | 2.46 | Source: Zambia DHS 2018. |
| 98 |  Tanzania TZAEastern Africa | 1.419 | 0.9984 | 1.91 | Source: Tanzania Household Budget Survey 2017-18. |
| 99 |  Gambia GMBWestern Africa | 1.398 | 0.8054 | 2.12 | Source: Gambia MICS 2018. |
| 100 |  Niger NERWestern Africa | 1.083 | 0.5215 | 1.74 | Source: Niger Enquete Harmonisee sur les Conditions de Vie des Menages (EHCVM) 2018-19. |
| 101 | Sri LankaLKASouthern Asia | 0.684 | 0.6157 | 0.77 | UIS based on LKA - LFS - Labour Force Survey: ILO Harmonized Microdata, https://ilostat.ilo.org/ | Age coverage - minimum age: 15 years old | Age coverage - maximum age: None |
02In 2018
At either end
The 5 countries at each end of the headline, then the highest and lowest on each other measure.
Highest
- 1United Arab Emirates47.293
- 2Iceland39.039
- 3Switzerland38.985
- 4Lithuania35.952
- 5Israel35.798
A higher value is the better result. The middle country reads 16.303. “Shared” marks a value another country also holds.
Each measure’s ends
Female
Highest
Iceland46.5323Lowest
Niger0.5215Middle country: 17.0065
Male
Highest
United Arab Emirates48.03Lowest
Sri Lanka0.77Middle country: 15.67
032017 → 2018
Since 2017
- +33 / −28countries joined / left
- 68values changed, of 68 in both
- 54 · 14rose · fell
- 0unchanged
Rose most
- Bahrain14.340 → 21.605+7.265
- Sweden23.937 → 30.992+7.056
- Ireland31.162 → 35.153+3.991
- North Macedonia17.221 → 21.126+3.905
- Finland24.336 → 28.085+3.749
Fell most
- Pakistan8.650 → 3.891−4.760
- Jordan20.927 → 19.328−1.599
- Rwanda5.616 → 4.133−1.483
- South Africa8.245 → 6.816−1.429
- Saudi Arabia25.975 → 24.753−1.222
+ Antigua and Barbuda+ Burkina Faso+ Belize+ Cameroon+ DR Congo+ Colombia+ Costa Rica+ Guinea+ Gambia+ Guinea-Bissau+ Grenada+ Guyana+ India+ Iraq+ Kazakhstan+ Kyrgyzstan+ Kiribati+ Lebanon+ Lesotho+ Luxembourg+ Latvia+ Madagascar+ Nigeria+ Papua New Guinea+ Paraguay+ San Marino+ Suriname+ Chad+ Thailand+ Tonga+ Tunisia+ Tanzania+ Uzbekistan − Afghanistan
 − Burundi
 − Benin
 − Bolivia
 − Bhutan
 − Djibouti
 − Ecuador
 − Fiji
 − United Kingdom
 − Ghana
 − Haiti
 − Cambodia
 − Laos
 − Liberia
 − Maldives
 − Mozambique
 − Malawi
 − Nepal
 − Philippines
 − Puerto Rico
 − Qatar
 − El Salvador
 − Togo
 − Tajikistan
 − Tuvalu
 − Uganda
 − Venezuela
 − Zimbabwe
Changes in value, not in places: a country’s place also moves when others do.
04Caveats
Read before you use
3 empty cells
An empty cell means the publisher gave no figure. It is never a zero.
05The files
Download and cite
- .csv
For a spreadsheet or code
101 rows · 18 KB · UTF-8, opens in Excel
Opens with 11 lines of source notes; the table starts on row 13.
Download bachelors-attainment-2018-nations-inquiry.csv - ↗
The publisher’s original
UIS’s own file, on its own site.
indicators
What this site changed: Reshaped to one row per country, with its ISO code; no value recalculated, rescaled or rounded. In full
Licence: CC BY-SA 4.0 · what it allows, in plain words
Cite this edition
UNESCO Institute for Statistics (UIS) (2018). Bachelor's or Higher Attainment, 2018 [data set], describing 2018. As held by Nations Inquiry, https://nationsinquiry.com/datasets/bachelors-attainment/2018
0611 held
Other years
‹ The year before
Bachelor's or Higher Attainment, 201796 countries
The year after ›
Bachelor's or Higher Attainment, 2019113 countries
All of them
Bachelor's or Higher Attainment: every year11 held, with the data dictionary, coverage and licence.
How it has moved, charted by country