
Photo: Jialiang Gao www.peace-on-earth.org derivative work: JamesA · CC BY-SA 3.0 · via Wikimedia Commons, shown in greyscale
Topic 13 of 18 · Country Index 2026

Yemen: Food & Agriculture
Which countries farm and supply food most effectively?
Yemen is placed 175th of 184 countries on food & agriculture in the Country Index 2026, from 2 of its 4 key statistics. Readings behind it: Progress Toward Productive and Sustainable Agriculture (SDG 2.4.1 Proxy) 2.43 (2024); Cereal Yield 801.1 (2023).
Share
Food & Agriculture
175th
of 184 countries placed
Placed from 2 of 4 key statistics
- 2.43Progress Toward Productive and Sustainable Agriculture (SDG 2.4.1 Proxy), 2024Current status score, from 1 (worst) to 5 (best), averaged over up to seven sub-indicators
- 801.1Cereal Yield, 2023Cereal yield (kg per hectare)
- —Dietary Energy Supply, 2024No reading for this country
- —Agriculture Orientation Index, 2024No reading for this country
01The evidence
The 4 key statistics that decide it
Only these place Yemen on food & agriculture — one vote each. Every value is the publisher’s own, read at the edition the Country Index 2026 used; the grey ticks are every other country it was compared with, lowest on the left.
Key 1 of 4
Progress Toward Productive and Sustainable Agriculture (SDG 2.4.1 Proxy)
Food and Agriculture Organization of the United Nations (FAO)
2024 edition · data for 2024 · CC BY 4.0
2.43
Current status score, from 1 (worst) to 5 (best), averaged over up to seven sub-indicators
Higher is better
Yemen: 2.43. Across the 186 countries in this edition, values run from 1.67 (Tuvalu) to 4.57 (Italy); the world median is 3.14.
- World median
- 3.14
- Best in Western Asia
- 4.29 Lebanon
- Land neighbours
- Oman 2.83 · Saudi Arabia 2.17
Key 2 of 4
Cereal Yield
Food and Agriculture Organization of the United Nations (FAO)
2023 edition · data for 2023 · CC BY 4.0
801.1
Cereal yield (kg per hectare)
Higher is better
Yemen: 801.1. Across the 179 countries in this edition, values run from 23 (Cabo Verde) to 29,147 (Oman); the world median is 3,072.
- World median
- 3,072
- Best in Western Asia
- 29,147 Oman
- Land neighbours
- Oman 29,147 · Saudi Arabia 5,122
Key 3 of 4
Dietary Energy Supply
Food and Agriculture Organization of the United Nations (FAO)
2024 edition · data for 2024 · CC BY 4.0
No reading
Dietary energy supply (kcal per person per day)
Higher is better
FAO publishes no 2024 figure for Yemen, so the standing rests on the other keys.
Across the 155 countries in this edition, values run from 1,757 (Somalia) to 3,962 (United States); the world median is 2,982.
- World median
- 2,982
- Best in Western Asia
- 3,774 Israel
- Land neighbours
- Oman 3,008 · Saudi Arabia 3,646
Key 4 of 4
Agriculture Orientation Index
Food and Agriculture Organization of the United Nations (FAO)
2024 edition · data for 2024 · CC BY 4.0
No reading
Agriculture orientation index (1.0 = spending matches sector size)
Higher is better
FAO publishes no 2024 figure for Yemen, so the standing rests on the other keys.
Across the 132 countries in this edition, values run from 0.03 (Ghana) to 5.38 (Singapore); the world median is 0.305.
- World median
- 0.305
- Best in Western Asia
- 1.25 Cyprus
- Land neighbours
- Oman 0.3 · Saudi Arabia 0.19
02Over time
Which way Yemen is moving
Each key’s published value, edition by edition, beside the world median. The Country Index 2026 is the first edition of the standing, so the standing itself has no history to chart yet.
Progress Toward Productive and Sustainable Agriculture (SDG 2.4.1 Proxy)
Current status score, from 1 (worst) to 5 (best), averaged over up to seven sub-indicators · higher is better
YemenWorld median
Yemen was at 2.43 in both 2015 and 2024; the world median went from 3.14 to 3.14.
Every year’s figures
Year Yemen World median 2024 2.4 3.1 2023 2.4 3.1 2022 2.1 3.2 2021 1.9 3.1 2020 2.0 3.1 2019 2.4 3.1 2018 2.4 3.2 2017 2.4 3.1 2016 2.4 3.1 2015 2.4 3.1 Cereal Yield
Cereal yield (kg per hectare) · higher is better
YemenWorld median
Yemen fell from 1,085 in 2000 to 801.1 in 2023; the world median went from 2,170 to 3,072.
Every year’s figures
Year Yemen World median 2023 801.1 3,072 2022 819.5 3,217 2021 1,524.8 3,003 2020 1,423.4 3,260 2019 864.9 3,106 2018 682.8 2,883 2017 699.0 2,984 2016 687.0 3,043 2015 784.2 3,000 2014 962.7 3,001 2013 1,008.2 2,970 2012 1,064.4 2,782 2011 1,022.5 2,754 2010 1,092.4 2,647 2009 995.2 2,653 2008 939.1 2,664 2007 1,019.5 2,553 2006 930.2 2,514 2005 713.1 2,512 2004 715.2 2,428 2003 785.2 2,331 2002 943.8 2,378 2001 1,064.3 2,199 2000 1,085.0 2,170 Agriculture Orientation Index
Agriculture orientation index (1.0 = spending matches sector size) · higher is better
YemenWorld median
Yemen fell from 0.14 in 2002 to 0.08 in 2014; the world median went from 0.34 to 0.3.
Every year’s figures
Year Yemen World median 2024 — 0.305 2023 — 0.305 2022 — 0.290 2021 — 0.260 2020 — 0.255 2019 — 0.265 2018 — 0.270 2017 — 0.260 2016 — 0.285 2015 — 0.305 2014 0.08 0.300 2013 0.08 0.285 2012 0.05 0.330 2011 0.07 0.290 2010 0.09 0.320 2009 0.08 0.370 2008 0.09 0.390 2007 0.10 0.410 2006 0.14 0.355 2005 0.15 0.325 2004 0.14 0.320 2003 0.12 0.320 2002 0.14 0.340 2001 — 0.360
03In context
Yemen beside its neighbours
A position reads best beside the countries around it. Every position below is a place among all 184 countries on food & agriculture, never a place within the region.
Yemen and the countries it borders
Standing among all 184; the key columns are the publishers’ own values.
| Country | Standing | Progress Toward Productive and Sustainable Agriculture (SDG 2.4.1 Proxy)Current status score, from 1 (worst) to 5 (best), averaged over up to seven sub-indicators | Cereal YieldCereal yield (kg per hectare) | Dietary Energy SupplyDietary energy supply (kcal per person per day) | Agriculture Orientation IndexAgriculture orientation index (1.0 = spending matches sector size) |
|---|---|---|---|---|---|
 Oman | 72nd | 2.83 | 29,147 | 3,008 | 0.3 |
 Saudi Arabia | =86th | 2.17 | 5,122 | 3,646 | 0.19 |
| Yemen | 175th | 2.43 | 801.1 | — | — |
“—”: no published reading in that edition. What a standing is
Across Western Asia
Every country in the sub-region, by its place among all 184.
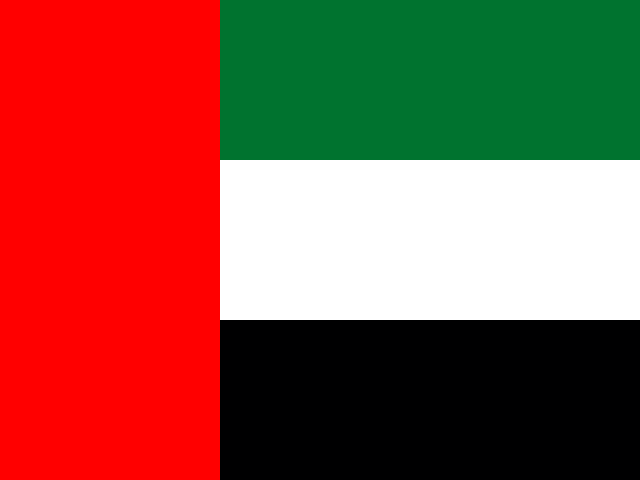
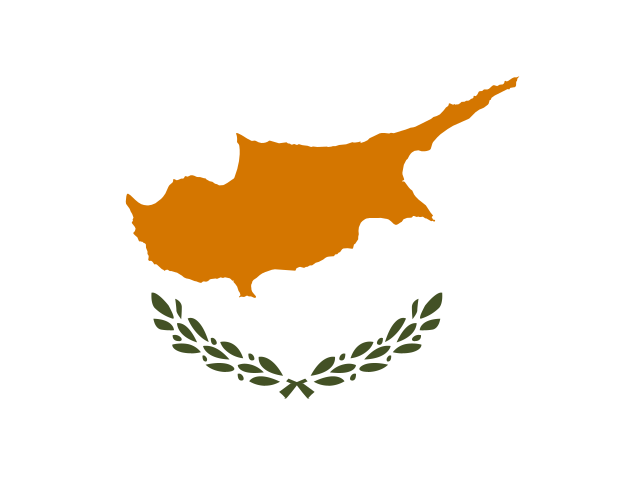
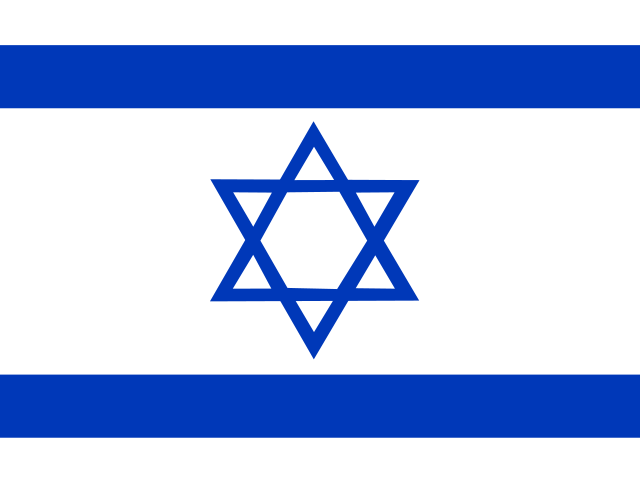
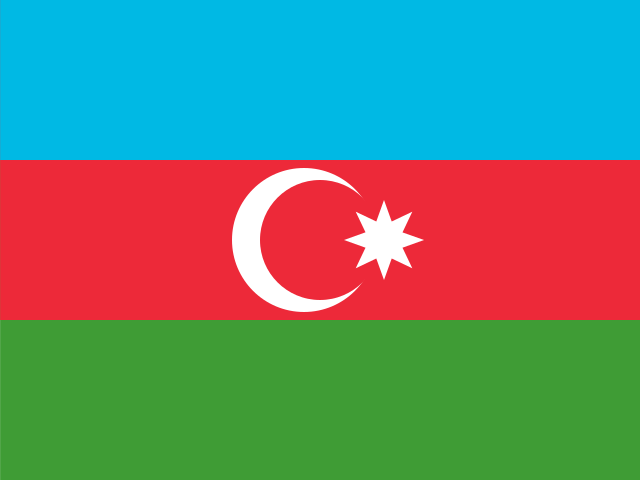

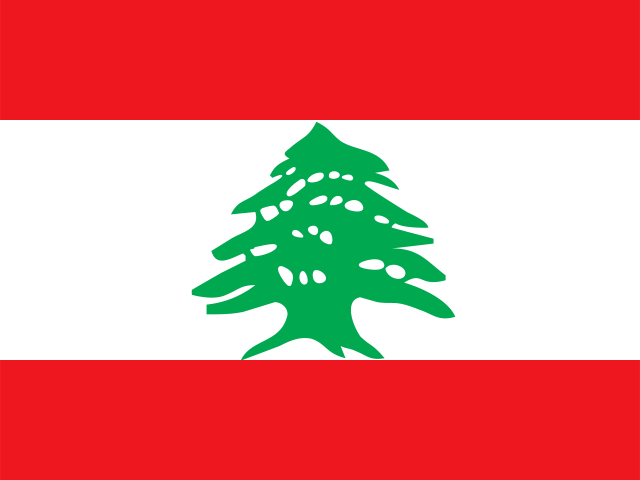



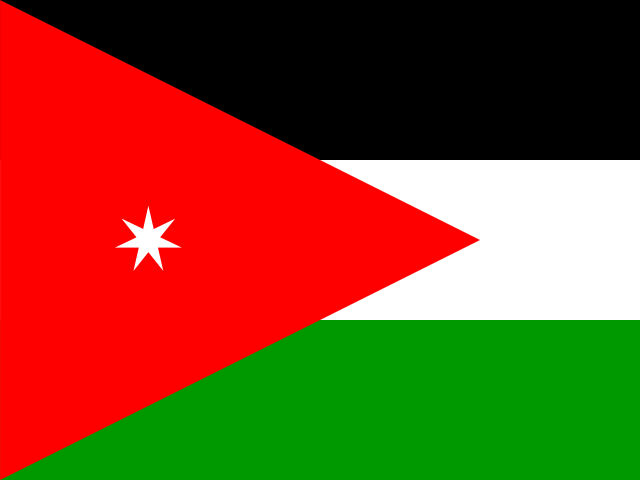
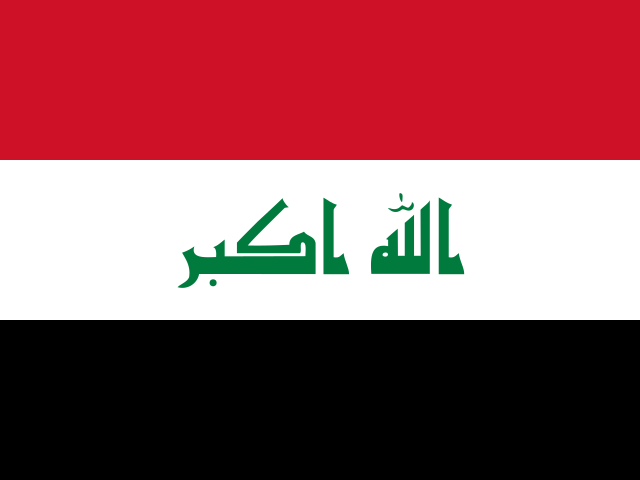
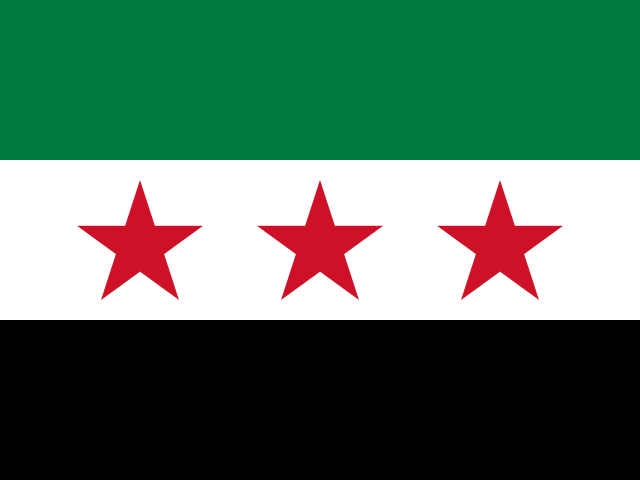

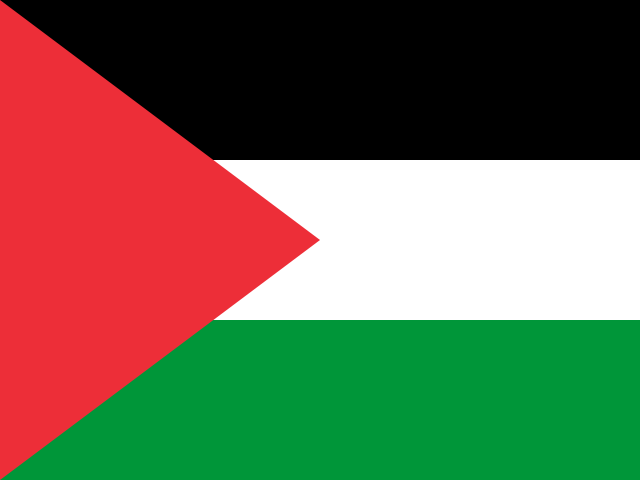
Placed either side on food & agriculture
The countries immediately above and below Yemen in the topic’s list.
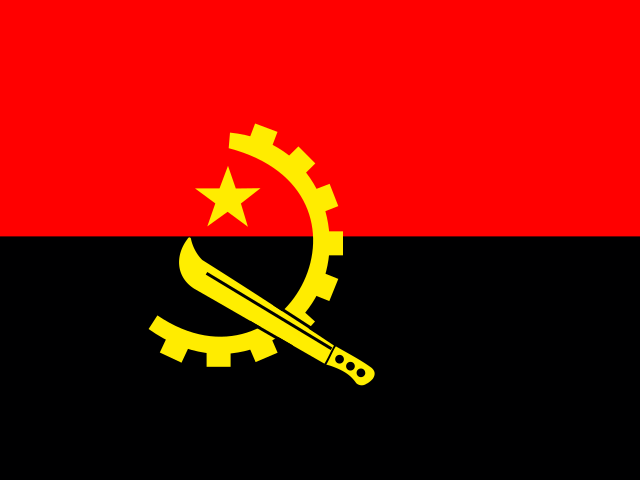
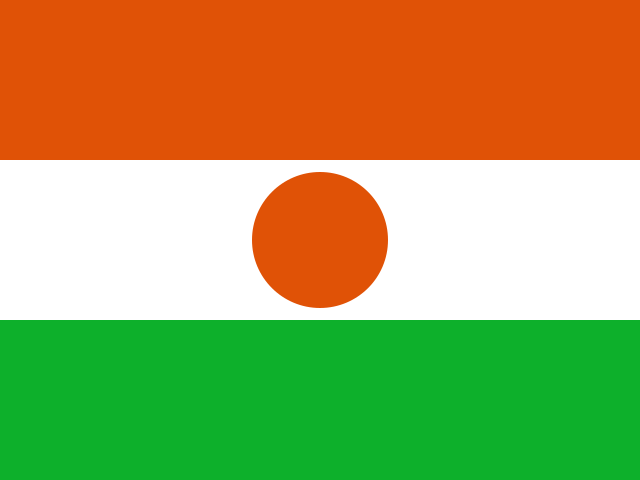
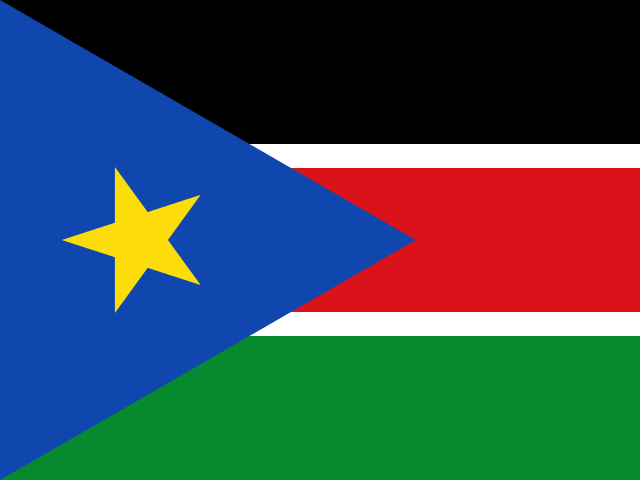


04Context, no vote
Where Yemen is ahead of the world, and behind
23 more statistics filed under food & agriculture, published in full and deliberately given no vote in the standing. Select a row for the publisher, the rank and the links.
Ahead of the world median3
Statistics on which Yemen does better than the middle country measured.
Food Production Index118.29106.08▼ Worsened since 2012
Yemen: 118.29 · world median 106.08 · Food production index (2014–2016 = 100). Food and Agriculture Organization of the United Nations (FAO), 2022 edition, data for 2022.
Published values in that edition run from 71.08 to 177.49; higher is better.
Position 50th of 195 · derived.
Crop Production Index118.58106.23▼ Worsened since 2012
Yemen: 118.58 · world median 106.23 · Crop production index (2014–2016 = 100). Food and Agriculture Organization of the United Nations (FAO), 2022 edition, data for 2022.
Published values in that edition run from 53.79 to 189.93; higher is better.
Position 51st of 195 · derived.
Livestock Production Index119.7107.06▲ Improved since 2012
Yemen: 119.7 · world median 107.06 · Livestock production index (2014–2016 = 100). Food and Agriculture Organization of the United Nations (FAO), 2022 edition, data for 2022.
Published values in that edition run from 35.52 to 190.08; higher is better.
Position 53rd of 194 · derived.
Behind the world median6
Statistics on which Yemen does worse than the middle country measured.
Agricultural Emissions Intensity2.631.565▼ Worsened since 2013
Yemen: 2.63 · world median 1.565 · Greenhouse gases from farming per value of agricultural output (kg CO₂eq per international dollar). Food and Agriculture Organization of the United Nations (FAO), 2023 edition, data for 2023.
Published values in that edition run from 0 to 28.2; lower is better.
Position 51st of 190 · derived, 1st = worst.
Share of Dietary Energy Supply from Cereals, Roots and Tubers6041No real change since 2012
Yemen: 60 · world median 41 · Share of dietary energy supply from cereals, roots and tubers (%). Food and Agriculture Organization of the United Nations (FAO), 2022 edition, data for 2022.
Published values in that edition run from 21 to 82; lower is better.
Legal Guarantees of Women's Equal Rights to Land13No earlier reading
Yemen: 1 · world median 3 · Level of legal guarantees of women's equal rights to land ownership and control, 1 (lowest) to 6 (highest). Food and Agriculture Organization of the United Nations (FAO), 2025 edition, data for 2025.
Published values in that edition run from 1 to 6; higher is better.
Fruit Supply per Person26.4784.83No real change since 2013
Yemen: 26.47 · world median 84.83 · Fruit available as food, excluding wine (kg per person per year). Food and Agriculture Organization of the United Nations (FAO), 2023 edition, data for 2023.
Published values in that edition run from 4.27 to 379.63; higher is better.
Global Report on Food Crises4822▲ Improved since 2016
Yemen: 48 · world median 22 · In IPC Phase 3+ (% of analysed population). Food Security Information Network (FSIN), 2025 edition, data for 2024.
Published values in that edition run from 3 to 56; lower is better.
Position 3rd of 44 · derived, 1st = worst.
Vegetable Supply per Person19.85102.69▼ Worsened since 2013
Yemen: 19.85 · world median 102.69 · Vegetables available as food (kg per person per year). Food and Agriculture Organization of the United Nations (FAO), 2023 edition, data for 2023.
Published values in that edition run from 6.89 to 412.72; higher is better.
No better end14
These describe the shape of a country — more is not better or worse, only different — so they are never ahead or behind.
Water Withdrawal by Sector90.7462.14No real change since 2012
Yemen: 90.74 · world median 62.14 · Freshwater withdrawn for agriculture (% of total). Food and Agriculture Organization of the United Nations (FAO), 2022 edition, data for 2022.
Published values in that edition run from 0 to 99.48.
Position 25th of 171 · derived, counted from the highest value.
Cereal Import Dependency Ratio93.442.8Moved since 2012
Yemen: 93.4 · world median 42.8 · Share of the cereal supply that is imported (%). Food and Agriculture Organization of the United Nations (FAO), 2022 edition, data for 2022.
Published values in that edition run from -1,894 to 100.
Employment in Agriculture31.6214.38Moved since 2015
Yemen: 31.62 · world median 14.38 · Employment in agriculture (% of total employment). International Labour Organization (ILO), 2025 edition, data for 2025.
Published values in that edition run from 0.095 to 85.34.
Position 54th of 182 · derived, counted from the highest value.
Fisheries and Aquaculture Production152,44052,375Moved since 2014
Yemen: 152,440 · world median 52,375 · Fish, crustaceans, molluscs and other aquatic animals caught or farmed, tonnes (live weight). Food and Agriculture Organization of the United Nations (FAO), 2024 edition, data for 2024.
Published values in that edition run from 0 to 70,500,841.
Agricultural Land44.4237.96No real change since 2013
Yemen: 44.42 · world median 37.96 · Agricultural land (% of land area). Food and Agriculture Organization of the United Nations (FAO), 2023 edition, data for 2023.
Published values in that edition run from 0.445 to 86.48.
Position 81st of 209 · derived, counted from the highest value.
Agricultural Emissions9,0038,635Moved since 2013
Yemen: 9,003 · world median 8,635 · Farm-gate emissions (kt CO₂eq). Food and Agriculture Organization of the United Nations (FAO), 2023 edition, data for 2023.
Published values in that edition run from 0 to 1,044,508.
Position 96th of 193 · derived, counted from the highest value.
Land Under Cereal Production543,000689,278Moved since 2013
Yemen: 543,000 · world median 689,278 · Land under cereal production (hectares). Food and Agriculture Organization of the United Nations (FAO), 2023 edition, data for 2023.
Published values in that edition run from 0 to 103,715,108.
Position 95th of 179 · derived, counted from the highest value.
Arable Land per Person0.0290.109No real change since 2013
Yemen: 0.029 · world median 0.109 · Arable land (hectares per person). Food and Agriculture Organization of the United Nations (FAO), 2023 edition, data for 2023.
Published values in that edition run from 0 to 1.459.
Position 159th of 206 · derived, counted from the highest value.
Fertilizer Consumption per Hectare8.9387.36Moved since 2013
Yemen: 8.93 · world median 87.36 · Fertilizer consumption (kg per hectare of arable land). Food and Agriculture Organization of the United Nations (FAO), 2023 edition, data for 2023.
Published values in that edition run from 0 to 2,926.
Position 158th of 188 · derived, counted from the highest value.
Livestock Density0.20.535No real change since 2013
Yemen: 0.2 · world median 0.535 · Livestock units per hectare of agricultural land. Food and Agriculture Organization of the United Nations (FAO), 2023 edition, data for 2023.
Published values in that edition run from 0.02 to 43.97.
Position 159th of 188 · derived, counted from the highest value.
Cropland Nitrogen Balance2.26137.63Moved since 2013
Yemen: 2.261 · world median 37.63 · Nitrogen surplus (+) or deficit (−) on cropland, kg per hectare. Food and Agriculture Organization of the United Nations (FAO), 2023 edition, data for 2023.
Published values in that edition run from -555.52 to 1,199.
Meat Supply per Person13.7257.83Moved since 2013
Yemen: 13.72 · world median 57.83 · Meat available as food (kg per person per year, carcass weight). Food and Agriculture Organization of the United Nations (FAO), 2023 edition, data for 2023.
Published values in that edition run from 3.49 to 156.95.
Pesticide Use per Hectare0.11.73Moved since 2014
Yemen: 0.1 · world median 1.73 · Pesticide use (kg per hectare of cropland). Food and Agriculture Organization of the United Nations (FAO), 2024 edition, data for 2024.
Published values in that edition run from 0 to 37.72.
Position 168th of 178 · derived, counted from the highest value.
Fish and Seafood Supply per Person2.0216.17Moved since 2013
Yemen: 2.02 · world median 16.17 · Fish and seafood available as food (kg per person per year, live-weight equivalent). Food and Agriculture Organization of the United Nations (FAO), 2023 edition, data for 2023.
Published values in that edition run from 0.38 to 83.81.
No current reading for Yemen
Agricultural Irrigated Land, Agriculture Orientation Index (last 2014), Agriculture, Forestry and Fishing Value Added (% of GDP) (last 2018), Agriculture, Forestry and Fishing Value Added per Worker (last 2018), Dietary Energy Supply, Organic Agricultural Area, Per Capita Food Supply Variability, Prevalence of Severe Food Insecurity, Prevalence of Undernourishment and Women's Share of Agricultural Landowners. Listed rather than hidden, so the page can be checked against it.
“Position · derived” is this site’s ordering of the published values, 1st = best unless the row says otherwise; the publisher ranks no country on it. Rank, position and standing
05Country Index 2026
Food & Agriculture among Yemen’s 15 topics
Food & Agriculture is Yemen’s 8th best-placed topic of 15. Strongest first, each marker at its share of that topic’s field.
- Environment & Sustainability49th of 1863/4 keys
- Poverty & Inequality118th of 1592/3 keys
- Energyjoint 127th of 1652/3 keys
- Health & Wellbeing172nd of 2003/4 keys
- Development & Human Capital170th of 1963/3 keys
- Mobility & Tradejoint 155th of 1773/4 keys
- Education & Knowledge187th of 1983/4 keys
- Food & Agriculture175th of 1842/4 keys
- Governance & Institutions189th of 1944/4 keys
- Democracy & Civil Liberties195th of 1983/4 keys
- Work & Labour181st of 1824/4 keys
- Risk & Resilience192nd of 1933/4 keys
- Digital & Technology198th of 1983/4 keys
- Gender & Equality183rd of 1832/4 keys
- Peace & Security177th of 1773/4 keys
No standing on Economy & Innovation: too few of those topics’ key statistics are published for this country.
06The top of the list
Who leads on food & agriculture
The three countries placed highest of 184, and the leaders Yemen can most readily be measured against.
 1
 Serbia
Southern Europe
1st of 184 · 4 of 4 keys
Photo: Lošmi derivative work: Jjtkk · CC BY-SA 3.0, greyscale
 2
 Austria
Western Europe
2nd of 184 · 4 of 4 keys
Photo: chensiyuan · CC BY-SA 4.0, greyscale
 3
 Malta
Southern Europe
3rd of 184 · 3 of 4 keys
Photo: Dirk Heldmaier derivative work: Jjtkk · CC BY-SA 3.0, greyscale
Placed highest nearby
Highest in Asia
 Japan5th2/4 keys
Highest in Western Asia
 Türkiye36th3/4 keys
This page
Yemen175th2/4 keys
Positions out of 184 placed on the topic. A country needs readings on enough keys to be placed, and the top of the list is often held on fewer of them.
07Credits
Sources and citation
Source
- Standing
- Country Index 2026 — this site’s own ordering, published under CC BY-SA 4.0.
- Key statistics
- 4 keys from 1 publisher, each named with its edition and licence under The keys.
- Context
- 23 more statistics under food & agriculture, each named beside its numbers; every edition and licence is on the datasets pages.
Reading this page
- A standing is this site’s ordering, named with its edition — never a publisher’s rank. 4 key statistics vote, one vote each; every country’s published value becomes a place within that key’s own field, the places are averaged, and the average is never published. A country needs 2 of the 4 keys to be placed. How every standing on this site is built
- What food & agriculture does not measure is set out on the subject page.
- The food & agriculture method, step by step
Cite this page
Nations Inquiry (2026). Yemen: Food & Agriculture — standing and statistics, Country Index 2026. https://nationsinquiry.com/countries/yemen/food
Photographs: Wikimedia Commons, in greyscale, the photographer and licence named beside each.