
Photo: Neil Palmer (CIAT) · CC BY-SA 2.0 · via Wikimedia Commons, shown in greyscale
Topic 12 of 18 · Country Index 2026

Nicaragua: Mobility & Trade
How connected is a country to the rest of the world?
Nicaragua is placed 147th of 177 countries on mobility & trade in the Country Index 2026, from 4 of its 4 key statistics. Readings behind it: Liner Shipping Connectivity Index 31.52 (2025); Container Import Dwell Time 5.5 (2024).
Share
Mobility & Trade
147th
of 177 countries placed
Placed from 4 of 4 key statistics
01The evidence
The 4 key statistics that decide it
Only these place Nicaragua on mobility & trade — one vote each. Every value is the publisher’s own, read at the edition the Country Index 2026 used; the grey ticks are every other country it was compared with, lowest on the left.
Key 1 of 4
Liner Shipping Connectivity Index
UN Trade and Development (UNCTAD)
2025 edition · data for 2025 · CC BY 3.0 IGO
31.52
LSCI (index, average Q1 2023 = 100)
Higher is better
Ranked 113th of 177 by UNCTAD
Nicaragua: 31.52. Across the 168 countries in this edition, values run from 4.13 (Turks and Caicos Islands) to 1,313 (China); the world median is 60.84.
- World median
- 60.84
- Best in Central America
- 213.84 Panama
- Land neighbours
- Costa Rica 88.85 · Honduras 59.93
5.5
Median days a full import container waits in port
Lower is better
Nicaragua: 5.5. Across the 156 countries in this edition, values run from 1 (Gibraltar) to 21.6 (Haiti); the world median is 4.4.
- World median
- 4.4
- Best in Central America
- 4.9 Panama
- Land neighbours
- Costa Rica 6.1 · Honduras 7.7
2.5
LPI score (1–5)
Higher is better
Ranked 97th of 139 by World Bank Group
Nicaragua: 2.5. Across the 139 countries in this edition, values run from 1.9 (Afghanistan) to 4.3 (Singapore); the world median is 2.9.
- World median
- 2.9
- Best in Central America
- 3.1 Panama
- Land neighbours
- Costa Rica 2.9 · Honduras 2.9
Key 4 of 4
ICT Goods Exports
UN Trade and Development (UNCTAD)
2024 edition · data for 2024 · CC BY 3.0 IGO
0.05
ICT goods exports (% of total goods exports)
Higher is better
Nicaragua: 0.05. Across the 120 countries in this edition, values run from 0 (Gambia) to 61.45 (Hong Kong); the world median is 0.975.
- World median
- 0.975
- Best in Central America
- 12.45 Mexico
- Land neighbours
- Costa Rica 1.01 · Honduras 0.19
02Over time
Which way Nicaragua is moving
Each key’s published value, edition by edition, beside the world median. The Country Index 2026 is the first edition of the standing, so the standing itself has no history to chart yet.
Liner Shipping Connectivity Index
LSCI (index, average Q1 2023 = 100) · higher is better
NicaraguaWorld median
Nicaragua rose from 23.66 in 2006 to 31.54 in 2026; the world median went from 52.25 to 56.21.
Every year’s figures
Year Nicaragua World median 2026 31.54 56.21 2025 31.52 60.84 2024 25.73 55.22 2023 28.14 54.78 2022 26.40 51.49 2021 24.92 52.64 2020 30.40 47.86 2019 22.25 51.05 2018 21.05 52.03 2017 28.97 49.87 2016 24.72 48.09 2015 24.50 49.13 2014 24.64 48.08 2013 21.74 51.32 2012 21.88 47.44 2011 16.84 50.26 2010 27.56 50.51 2009 27.04 53.04 2008 26.50 51.68 2007 28.18 55.78 2006 23.66 52.25 Logistics Performance Index
LPI score (1–5) · higher is better
NicaraguaWorld median
Nicaragua rose from 2.214 in 2007 to 2.5 in 2023; the world median went from 2.529 to 2.9.
Every year’s figures
Year Nicaragua World median 2023 2.50 2.900 2018 — 2.706 2016 2.53 2.734 2014 2.65 2.753 2012 — 2.773 2010 2.54 2.746 2007 2.21 2.529 ICT Goods Exports
ICT goods exports (% of total goods exports) · higher is better
NicaraguaWorld median
Nicaragua fell from 0.13 in 2000 to 0.05 in 2024; the world median went from 0.43 to 0.975.
Every year’s figures
Year Nicaragua World median 2024 0.05 0.975000 2023 0.05 0.690000 2022 0.03 0.565000 2021 0.04 0.550000 2020 0.04 0.680000 2019 0.06 0.625000 2018 0.07 0.480000 2017 0.07 0.630000 2016 0.07 0.865000 2015 0.07 0.790000 2014 0.08 0.760000 2013 — 0.645000 2012 — 0.630000 2011 0.14 0.535000 2010 0.14 0.560000 2009 0.32 0.780000 2008 0.11 0.595000 2007 0.14 0.660000 2006 0.21 0.445000 2005 0.14 0.570000 2004 0.31 0.535000 2003 0.19 0.530000 2002 0.06 0.510000 2001 0.13 0.490000 2000 0.13 0.430000
03In context
Nicaragua beside its neighbours
A position reads best beside the countries around it. Every position below is a place among all 177 countries on mobility & trade, never a place within the region.
Nicaragua and the countries it borders
Standing among all 177; the key columns are the publishers’ own values.
| Country | Standing | Liner Shipping Connectivity IndexLSCI (index, average Q1 2023 = 100) | Container Import Dwell TimeMedian days a full import container waits in port | Logistics Performance IndexLPI score (1–5) | ICT Goods ExportsICT goods exports (% of total goods exports) |
|---|---|---|---|---|---|
 Costa Rica | 84th | 88.85 | 6.1 | 2.9 | 1.01 |
 Honduras | =128th | 59.93 | 7.7 | 2.9 | 0.19 |
| Nicaragua | 147th | 31.52 | 5.5 | 2.5 | 0.05 |
“—”: no published reading in that edition. What a standing is
Across Central America
Every country in the sub-region, by its place among all 177.




Placed either side on mobility & trade
The countries immediately above and below Nicaragua in the topic’s list.






04Context, no vote
Where Nicaragua is ahead of the world, and behind
23 more statistics filed under mobility & trade, published in full and deliberately given no vote in the standing. Select a row for the publisher, the rank and the links.
Ahead of the world median3
Statistics on which Nicaragua does better than the middle country measured.
ICT Services ExportsUNCTAD · 2024 · world median 7.47419.447.474No real change since 2014
Nicaragua: 19.44 · world median 7.474 · ICT services exports (% of services exports). UN Trade and Development (UNCTAD), 2024 edition, data for 2024.
Published values in that edition run from 0 to 56.25; higher is better.
Position 21st of 118 · derived.
Cost of Sending RemittancesWorld Bank Group · 2023 · world median 3.2252.3333.225▼ Worsened since 2016
Nicaragua: 2.333 · world median 3.225 · Average cost of sending $200 home (% of the amount). World Bank Group, 2023 edition, data for 2023.
Published values in that edition run from -49.69 to 19.63; lower is better.
Position 63rd of 93 · derived, 1st = worst.
Digital Services Trade Restrictiveness IndexOECD · 2025 · world median 0.2060.1840.206▲ Improved since 2015
Nicaragua: 0.184 · world median 0.206 · Digital STRI (0 = open, 1 = closed). OECD, 2025 edition, data for 2025.
Published values in that edition run from 0.021 to 0.649; lower is better.
Position 71st of 125 · derived, 1st = worst.
Behind the world median3
Statistics on which Nicaragua does worse than the middle country measured.
Digitally-Deliverable Services ExportsUNCTAD · 2024 · world median 25.4221.3925.42▲ Improved since 2014
Nicaragua: 21.39 · world median 25.42 · Digitally-deliverable services exports (% of services exports). UN Trade and Development (UNCTAD), 2024 edition, data for 2024.
Published values in that edition run from 0.377 to 87.15; higher is better.
Position 96th of 170 · derived.
Average Time to Clear Exports Through CustomsWorld Bank Group · 2025 · world median 4.4565.1914.456No earlier reading
Nicaragua: 5.191 · world median 4.456 · Average time to clear exports through customs (days). World Bank Group, 2025 edition, data for 2025.
Published values in that edition run from 1 to 27.46; lower is better.
Position 76th of 174 · derived, 1st = worst.
Freedom of Foreign MovementV-Dem Institute, University of Gothenburg · 2025 · world median 1.2-3.1721.2▼ Worsened since 2015
Nicaragua: -3.172 · world median 1.2 · Original latent estimate (≈ −3.6 to +2.9); higher = freer movement. V-Dem Institute, University of Gothenburg, 2025 edition, data for 2025.
Published values in that edition run from -3.642 to 2.727; higher is better.
Position 175th of 176 · derived.
No better end17
These describe the shape of a country — more is not better or worse, only different — so they are never ahead or behind.
Terms of Trade IndexUNCTAD · 2025 · world median 103.23129.05103.23Moved since 2015
Nicaragua: 129.05 · world median 103.23 · Terms of trade index (2015 = 100). UN Trade and Development (UNCTAD), 2025 edition, data for 2025.
Published values in that edition run from 38.2 to 1,448.
Imports of Goods and Services (% of GDP)World Bank Group · 2025 · world median 41.7254.8641.72Moved since 2015
Nicaragua: 54.86 · world median 41.72 · Imports of goods and services (% of GDP). World Bank Group, 2025 edition, data for 2025.
Published values in that edition run from 1.279 to 196.89.
Position 44th of 138 · derived, counted from the highest value.
EmigrantsUN DESA Population Division · 2024 · world median 444,451905,251444,451Moved since 2015
Nicaragua: 905,251 · world median 444,451 · Migrants from the country living abroad, mid-year (people). UN DESA Population Division, 2024 edition, data for 2024.
Published values in that edition run from 313 to 18,533,845.
Trade (% of GDP)World Bank Group · 2025 · world median 79.6896.4579.68Moved since 2015
Nicaragua: 96.45 · world median 79.68 · Exports plus imports (% of GDP). World Bank Group, 2025 edition, data for 2025.
Published values in that edition run from 2.382 to 396.65.
Position 49th of 138 · derived, counted from the highest value.
Exports of Goods and Services (% of GDP)World Bank Group · 2025 · world median 36.3441.5936.34No real change since 2015
Nicaragua: 41.59 · world median 36.34 · Exports of goods and services (% of GDP). World Bank Group, 2025 edition, data for 2025.
Published values in that edition run from 1.103 to 199.76.
Position 56th of 138 · derived, counted from the highest value.
Cereal Import Dependency RatioFAO · 2022 · world median 42.850.542.8Moved since 2012
Nicaragua: 50.5 · world median 42.8 · Share of the cereal supply that is imported (%). Food and Agriculture Organization of the United Nations (FAO), 2022 edition, data for 2022.
Published values in that edition run from -1,894 to 100.
Commodity Export DependenceUNCTAD · 2024 · world median 67.1757.8667.17Moved since 2014
Nicaragua: 57.86 · world median 67.17 · Commodity exports (% of merchandise exports, three-year average). UN Trade and Development (UNCTAD), 2024 edition, data for 2024.
Published values in that edition run from 4.605 to 99.77.
Export Concentration IndexUNCTAD · 2025 · world median 0.3060.270.306Moved since 2015
Nicaragua: 0.27 · world median 0.306 · Export concentration index (0–1, normalised Herfindahl–Hirschman). UN Trade and Development (UNCTAD), 2025 edition, data for 2025.
Published values in that edition run from 0.059 to 0.933.
Tariff Rate, Applied, Weighted Mean, All ProductsWorld Bank Group · 2022 · world median 3.662.043.66No real change since 2012
Nicaragua: 2.04 · world median 3.66 · Applied tariff rate, trade-weighted mean (%). World Bank Group, 2022 edition, data for 2022.
Published values in that edition run from 0 to 29.52.
Services ExportsUNCTAD · 2025 · world median 9.6026.1029.602Moved since 2015
Nicaragua: 6.102 · world median 9.602 · Services exports (% of GDP). UN Trade and Development (UNCTAD), 2025 edition, data for 2025.
Published values in that edition run from 0.085 to 166.21.
Net Migration RateUN DESA Population Division · 2023 · world median -0.133-1.172-0.133Moved since 2013
Nicaragua: -1.172 · world median -0.133 · Net migrants per 1,000 population. UN DESA Population Division, 2023 edition, data for 2023.
Published values in that edition run from -61.68 to 39.62.
International MigrantsUN DESA Population Division · 2024 · world median 223,32343,757223,323No real change since 2015
Nicaragua: 43,757 · world median 223,323 · International migrants living in the country, mid-year (people). UN DESA Population Division, 2024 edition, data for 2024.
Published values in that edition run from 246 to 52,375,047.
Outbound Mobility Ratio, TertiaryUIS · 2023 · world median 5.2792.2075.279Moved since 2002
Nicaragua: 2.207 · world median 5.279 · Outbound mobility ratio, tertiary (% of tertiary enrolment at home). UNESCO Institute for Statistics (UIS), 2023 edition, data for 2023.
Published values in that edition run from 0.333 to 1,724.
Creative Goods ExportsUNCTAD · 2024 · world median 1.2350.1181.235No real change since 2014
Nicaragua: 0.118 · world median 1.235 · Creative goods exports (% of merchandise exports). UN Trade and Development (UNCTAD), 2024 edition, data for 2024.
Published values in that edition run from 0 to 37.23.
Merchant Fleet by Country of OwnershipUNCTAD · 2026 · world median 275.732.174275.73Moved since 2016
Nicaragua: 2.174 · world median 275.73 · Merchant fleet owned (thousand dead-weight tons). UN Trade and Development (UNCTAD), 2026 edition, data for 2026.
Published values in that edition run from 0 to 397,071.
International Migrants as a Share of PopulationUN DESA Population Division · 2024 · world median 6.0890.6336.089No real change since 2015
Nicaragua: 0.633 · world median 6.089 · International migrants (% of population). UN DESA Population Division, 2024 edition, data for 2024.
Published values in that edition run from 0.02 to 100.
Container Port TrafficUNCTAD · 2024 · world median 1,827,788167,6821,827,788Moved since 2014
Nicaragua: 167,682 · world median 1,827,788 · Container port traffic (TEU, twenty-foot equivalent units). UN Trade and Development (UNCTAD), 2024 edition, data for 2024.
Published values in that edition run from 17,263 to 299,703,800.
Position 94th of 103 · derived, counted from the highest value.
No current reading for Nicaragua
Asylum-Seekers by Country of Asylum (last 2023), Creative Services Exports, FDI Regulatory Restrictiveness Index, Foreign Value Added Share of Gross Exports, Inbound Mobility Rate, Tertiary (last 2023) and Refugee Population by Country of Asylum (last 2023). Listed rather than hidden, so the page can be checked against it.
“Position · derived” is this site’s ordering of the published values, 1st = best unless the row says otherwise; the publisher ranks no country on it. Rank, position and standing
05Country Index 2026
Mobility & Trade among Nicaragua’s 15 topics
Mobility & Trade is Nicaragua’s 12th best-placed topic of 15. Strongest first, each marker at its share of that topic’s field.
- Environment & Sustainabilityjoint 15th of 1862/4 keys
- Work & Labourjoint 78th of 1824/4 keys
- Energy73rd of 1653/3 keys
- Health & Wellbeingjoint 90th of 2002/4 keys
- Gender & Equality87th of 1834/4 keys
- Risk & Resiliencejoint 116th of 1934/4 keys
- Economy & Innovation119th of 1764/4 keys
- Development & Human Capital135th of 1963/3 keys
- Education & Knowledge146th of 1984/4 keys
- Peace & Securityjoint 132nd of 1774/4 keys
- Digital & Technologyjoint 150th of 1983/4 keys
- Mobility & Trade147th of 1774/4 keys
- Poverty & Inequalityjoint 138th of 1592/3 keys
- Governance & Institutions181st of 1944/4 keys
- Democracy & Civil Liberties193rd of 1984/4 keys
No standing on Food & Agriculture: too few of those topics’ key statistics are published for this country.
06The top of the list
Who leads on mobility & trade
The three countries placed highest of 177, and the leaders Nicaragua can most readily be measured against.
 1
 Singapore
South-eastern Asia
1st of 177 · 4 of 4 keys
Photo: Khairul Nizam . · CC BY 2.0, greyscale
 2
 Macau
Eastern Asia
2nd of 177 · 2 of 4 keys
Photo: Diego Delso · CC BY-SA 3.0, greyscale
 3
 Hong Kong
Eastern Asia
3rd of 177 · 4 of 4 keys
Photo: Base64 and Derivative work by Globe-trotter · CC BY-SA 3.0, greyscale
Placed highest nearby
Highest in Americas
 United States7th4/4 keys
Highest in Central America
 Mexico=55th4/4 keys
This page
Nicaragua147th4/4 keys
Positions out of 177 placed on the topic. A country needs readings on enough keys to be placed, and the top of the list is often held on fewer of them.
07Analysis
Charts and analysis about Nicaragua and mobility & trade
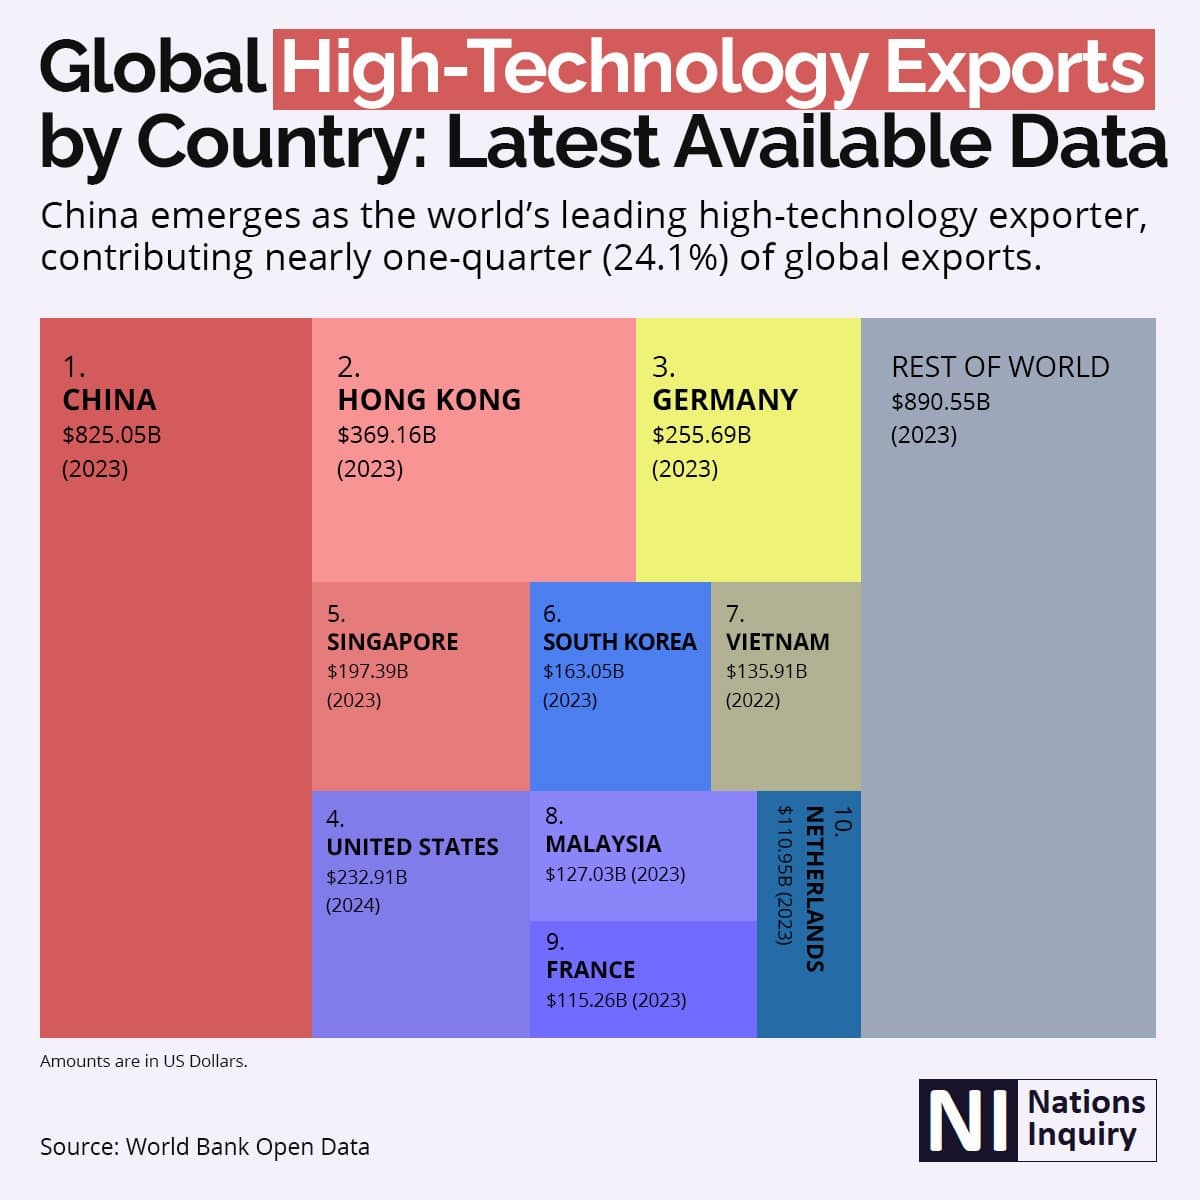
On mobility & trade
China Leads Global High-Technology Exports
The world’s ten largest high-technology exporters as a treemap, with the rest of the world beside them. Each country’s figure is its own most recent year, between 2022 and 2024.

On mobility & trade
The World’s Safest Airlines for 2025
The eleven safest airlines of 2025, each beside the country it is based in, and the nine things the grading looks at. Three airlines share third place, and the publisher gives an order but no score.

On mobility & trade
The world’s most powerful passports for 2025
Sixteen passports, their mobility scores, and the visa-free, visa-on-arrival and visa-required split behind each. Fourteen share third place while differing in how they reach it.
08Questions
Nicaragua on mobility & trade: questions answered
Every answer is built from the numbers on this page, so none can say something the page does not.
How does Nicaragua rank on mobility & trade?
Nicaragua is placed 147th of 177 countries on Mobility & Trade in the Country Index 2026, from 4 of its 4 key statistics (Liner Shipping Connectivity Index, Container Import Dwell Time, Logistics Performance Index and ICT Goods Exports). The position is this site’s ordering of published statistics, not a rank any publisher printed.
What is the latest Liner Shipping Connectivity Index figure for Nicaragua?
31.52 in 2025 (lSCI (index, average Q1 2023 = 100)), according to UN Trade and Development (UNCTAD). The world median in the same edition was 60.84.
What is the latest Container Import Dwell Time figure for Nicaragua?
5.5 in 2024 (median days a full import container waits in port), according to World Bank Group. The world median in the same edition was 4.4.
How does Nicaragua compare with Honduras on mobility & trade?
Honduras is placed joint 128th of 177, and Nicaragua 147th. Liner Shipping Connectivity Index: Honduras 59.93, Nicaragua 31.52; Container Import Dwell Time: Honduras 7.7, Nicaragua 5.5; Logistics Performance Index: Honduras 2.9, Nicaragua 2.5; ICT Goods Exports: Honduras 0.19, Nicaragua 0.05.
How have Nicaragua’s mobility & trade figures changed?
Liner Shipping Connectivity Index rose from 23.66 in 2006 to 31.54 in 2026; Logistics Performance Index rose from 2.214 in 2007 to 2.5 in 2023; ICT Goods Exports fell from 0.13 in 2000 to 0.05 in 2024.
Which mobility & trade statistics are missing for Nicaragua?
No current reading is published for Nicaragua on Asylum-Seekers by Country of Asylum, Creative Services Exports, FDI Regulatory Restrictiveness Index, Foreign Value Added Share of Gross Exports, Inbound Mobility Rate, Tertiary and Refugee Population by Country of Asylum. They are listed rather than hidden, so the evidence on the page can be checked against it.
09Method
Method, sources and how to cite
What this topic does not measure
Passport strength and freedom of movement for people are not measured with a key, because the data behind passport rankings is not licensed for reuse here. Trade as a share of the economy, remittance costs and student mobility are published here as context.
How the Mobility & Trade standing is decided
A standing is this site’s ordering, named with its edition — never a publisher’s rank. 4 key statistics vote, one vote each; every country’s published value becomes a place within that key’s own field, the places are averaged, and the average is never published. A country needs 2 of the 4 keys to be placed.
The mobility & trade method, step by stepHow every standing on this site is built
The key statistics and their licences
- Liner Shipping Connectivity Index — UN Trade and Development (UNCTAD), CC BY 3.0 IGO
- Container Import Dwell Time — World Bank Group, CC BY 4.0
- Logistics Performance Index — World Bank Group, CC BY 4.0
- ICT Goods Exports — UN Trade and Development (UNCTAD), CC BY 3.0 IGO
The other 23 statistics on this page come from 7 publishers, each named beside its numbers, with every edition and licence on the datasets pages.
The standing itself is part of the Country Index 2026, published under CC BY-SA 4.0.
Photographs
Nicaragua’s banner and the countries placed highest, from their profiles: Wikimedia Commons, shown in greyscale, each used under the licence named.
- Nicaragua (banner) — Neil Palmer (CIAT), CC BY-SA 2.0
- Singapore — Khairul Nizam ., CC BY 2.0
- Macau — Diego Delso, CC BY-SA 3.0
- Hong Kong — Base64 and Derivative work by Globe-trotter, CC BY-SA 3.0
Cite this page
Nations Inquiry (2026). Nicaragua: Mobility & Trade — standing and statistics, Country Index 2026. https://nationsinquiry.com/countries/nicaragua/mobility