
Photo: Wolfgang Steinkläubl · CC BY-SA 3.0 · via Wikimedia Commons, shown in greyscale
Topic 03 of 18 · Country Index 2026

Croatia: Work & Labour
Can people find work, and on what terms?
Croatia is placed 41st of 182 countries on work & labour in the Country Index 2026, from 4 of its 4 key statistics. Readings behind it: Employment-to-Population Ratio 49.53 (2025); Labour Income Share 62.91 (2025).
Share
Work & Labour
41st
of 182 countries placed
Placed from 4 of 4 key statistics
01The evidence
The 4 key statistics that decide it
Only these place Croatia on work & labour — one vote each. Every value is the publisher’s own, read at the edition the Country Index 2026 used; the grey ticks are every other country it was compared with, lowest on the left.
Key 1 of 4
Employment-to-Population Ratio
International Labour Organization (ILO)
2025 edition · data for 2025 · CC BY 4.0
49.53
Employed share of the population aged 15+ (%)
Higher is better
Croatia: 49.53. Across the 182 countries in this edition, values run from 21.21 (São Tomé and Príncipe) to 86.9 (Qatar); the world median is 57.72.
- World median
- 57.72
- Best in Southern Europe
- 62.13 Malta
- Land neighbours
- Bosnia and Herzegovina 43.58 · Hungary 57.84 · Montenegro 50.1 · Serbia 54.93 · Slovenia 55.74
Key 3 of 4
Unemployment Rate
International Labour Organization (ILO)
2025 edition · data for 2025 · CC BY 4.0
5.002
Unemployment (% of labour force)
Lower is better
Croatia: 5.002. Across the 182 countries in this edition, values run from 0.13 (Qatar) to 34.2 (Eswatini); the world median is 5.084.
- World median
- 5.084
- Best in Southern Europe
- 2.896 Malta
- Land neighbours
- Bosnia and Herzegovina 11.04 · Hungary 4.521 · Montenegro 13.57 · Serbia 7.123 · Slovenia 3.175
Key 4 of 4
Vulnerable Employment
International Labour Organization (ILO)
2025 edition · data for 2025 · CC BY 4.0
6.346
Vulnerable employment (% of total employment)
Lower is better
Croatia: 6.346. Across the 182 countries in this edition, values run from 0.456 (Qatar) to 90.22 (Chad); the world median is 28.67.
- World median
- 28.67
- Best in Southern Europe
- 6.346 Croatia
- Land neighbours
- Bosnia and Herzegovina 18.11 · Hungary 7.829 · Montenegro 14.28 · Serbia 23.89 · Slovenia 10.61
02Over time
Which way Croatia is moving
Each key’s published value, edition by edition, beside the world median. The Country Index 2026 is the first edition of the standing, so the standing itself has no history to chart yet.
Employment-to-Population Ratio
Employed share of the population aged 15+ (%) · higher is better
CroatiaWorld median
Croatia rose from 44.18 in 2000 to 49.53 in 2025; the world median went from 55.86 to 57.72.
Every year’s figures
Year Croatia World median 2025 49.535 57.720 2024 49.739 57.694 2023 49.058 58.158 2022 48.931 57.688 2021 48.145 56.066 2020 47.204 55.691 2019 47.536 57.871 2018 46.696 56.911 2017 45.695 56.738 2016 44.500 56.845 2015 44.095 56.788 2014 43.204 56.774 2013 42.012 56.229 2012 43.090 56.289 2011 44.678 56.297 2010 46.430 56.212 2009 48.169 56.255 2008 48.553 57.308 2007 47.631 56.933 2006 46.307 56.685 2005 46.024 56.129 2004 45.687 55.465 2003 44.566 55.630 2002 43.971 55.843 2001 43.966 56.018 2000 44.177 55.861 Labour Income Share
Labour income share of GDP (%) · higher is better
CroatiaWorld median
Croatia rose from 60.93 in 2004 to 62.91 in 2025; the world median went from 46.01 to 46.23.
Every year’s figures
Year Croatia World median 2025 62.91 46.230 2024 62.76 46.060 2023 57.88 45.900 2022 56.43 45.615 2021 55.76 45.433 2020 63.92 47.267 2019 59.53 46.277 2018 60.26 46.187 2017 56.99 46.467 2016 57.29 46.798 2015 59.08 46.876 2014 56.98 47.281 2013 56.72 46.887 2012 57.82 46.231 2011 57.74 45.679 2010 58.29 46.024 2009 59.66 47.071 2008 57.77 45.312 2007 58.01 45.246 2006 58.35 45.670 2005 59.92 46.265 2004 60.93 46.012 Unemployment Rate
Unemployment (% of labour force) · lower is better
CroatiaWorld median
Croatia fell from 16.06 in 2000 to 5.002 in 2025; the world median went from 6.918 to 5.084.
Every year’s figures
Year Croatia World median 2025 5.002 5.08 2024 5.000 5.15 2023 6.121 5.21 2022 6.811 5.34 2021 7.483 6.04 2020 7.389 6.38 2019 6.551 5.36 2018 8.322 5.35 2017 11.078 5.59 2016 13.015 5.90 2015 16.150 6.41 2014 17.209 6.58 2013 17.231 6.71 2012 16.046 6.79 2011 13.678 6.90 2010 11.620 7.04 2009 9.202 6.67 2008 8.530 5.79 2007 9.909 6.00 2006 11.130 6.50 2005 12.598 7.09 2004 13.664 6.80 2003 13.924 6.95 2002 15.053 6.91 2001 15.822 6.96 2000 16.064 6.92 Vulnerable Employment
Vulnerable employment (% of total employment) · lower is better
CroatiaWorld median
Croatia fell from 18.76 in 2000 to 6.346 in 2025; the world median went from 35.67 to 28.67.
Every year’s figures
Year Croatia World median 2025 6.35 28.67 2024 6.68 29.04 2023 7.25 29.33 2022 7.99 29.67 2021 8.80 30.01 2020 8.84 30.54 2019 9.22 29.98 2018 9.66 30.15 2017 10.13 29.93 2016 10.67 29.91 2015 11.62 30.26 2014 11.55 30.47 2013 11.99 31.14 2012 13.00 31.00 2011 13.92 31.41 2010 14.00 32.37 2009 13.80 32.59 2008 13.87 31.76 2007 14.40 33.47 2006 15.08 34.27 2005 15.93 34.66 2004 16.82 35.51 2003 18.00 35.90 2002 18.86 35.96 2001 19.21 35.27 2000 18.76 35.67
03In context
Croatia beside its neighbours
A position reads best beside the countries around it. Every position below is a place among all 182 countries on work & labour, never a place within the region.
Croatia and the countries it borders
Standing among all 182; the key columns are the publishers’ own values.
| Country | Standing | Employment-to-Population RatioEmployed share of the population aged 15+ (%) | Labour Income ShareLabour income share of GDP (%) | Unemployment RateUnemployment (% of labour force) | Vulnerable EmploymentVulnerable employment (% of total employment) |
|---|---|---|---|---|---|
 Slovenia | 18th | 55.74 | 61.93 | 3.175 | 10.61 |
 Hungary | =39th | 57.84 | 51.3 | 4.521 | 7.829 |
| Croatia | 41st | 49.53 | 62.91 | 5.002 | 6.346 |
 Serbia | 98th | 54.93 | 53.64 | 7.123 | 23.89 |
 Bosnia and Herzegovina | =119th | 43.58 | 56.17 | 11.04 | 18.11 |
 Montenegro | 124th | 50.1 | 51.37 | 13.57 | 14.28 |
“—”: no published reading in that edition. What a standing is
Across Southern Europe
Every country in the sub-region, by its place among all 182.







Placed either side on work & labour
The countries immediately above and below Croatia in the topic’s list.





04Context, no vote
Where Croatia is ahead of the world, and behind
32 more statistics filed under work & labour, published in full and deliberately given no vote in the standing. Select a row for the publisher, the rank and the links.
Ahead of the world median18
Statistics on which Croatia does better than the middle country measured.
Length of Paid Maternity LeaveWorld Bank Group · 2025 · world median 9820898No real change since 2015
Croatia: 208 · world median 98 · Paid maternity leave set in law (calendar days). World Bank Group, 2026 edition, data for 2025.
Published values in that edition run from 0 to 410; higher is better.
Length of Paid Paternity LeaveWorld Bank Group · 2025 · world median 3283▲ Improved since 2015
Croatia: 28 · world median 3 · Paid paternity leave set in law (calendar days). World Bank Group, 2026 edition, data for 2025.
Published values in that edition run from 0 to 196; higher is better.
Employment Injury Protection CoverageILO · 2024 · world median 45.989.545.9No earlier reading
Croatia: 89.5 · world median 45.9 · Labour force covered in the event of a work injury (%). International Labour Organization (ILO), 2024 edition, data for 2024.
Published values in that edition run from 0 to 100; higher is better.
Youth Not in Education, Employment or TrainingILO · 2024 · world median 14.318.08314.31▲ Improved since 2014
Croatia: 8.083 · world median 14.31 · Youth not in education, employment or training (%). International Labour Organization (ILO), 2024 edition, data for 2024.
Published values in that edition run from 3.975 to 65.73; lower is better.
Position 82nd of 97 · derived, 1st = worst.
GDP per Person EmployedWorld Bank Group · 2025 · world median 47,384103,33247,384▲ Improved since 2015
Croatia: 103,332 · world median 47,384 · GDP per person employed (constant 2021 international $). World Bank Group, 2025 edition, data for 2025.
Published values in that edition run from 2,456 to 262,554; higher is better.
Position 31st of 168 · derived.
Labour Productivity per Hour WorkedILO · 2025 · world median 22.1658.7422.16▲ Improved since 2015
Croatia: 58.74 · world median 22.16 · Output per hour worked (constant 2021 international $ at PPP). International Labour Organization (ILO), 2025 edition, data for 2025.
Published values in that edition run from 0.92 to 164.65; higher is better.
Position 35th of 182 · derived.
Average Monthly Earnings of EmployeesILO · 2024 · world median 1,6364,6221,636▲ Improved since 2014
Croatia: 4,622 · world median 1,636 · Average monthly earnings of employees (2021 PPP $). International Labour Organization (ILO), 2024 edition, data for 2024.
Published values in that edition run from 193.28 to 9,307; higher is better.
Position 15th of 75 · derived.
Agriculture, Forestry and Fishing Value Added per WorkerWorld Bank Group · 2025 · world median 6,74226,1406,742▲ Improved since 2015
Croatia: 26,140 · world median 6,742 · Agricultural value added per worker (constant 2015 US$). World Bank Group, 2025 edition, data for 2025.
Published values in that edition run from 210.77 to 150,632; higher is better.
Position 30th of 151 · derived.
Firms with a Female Top ManagerWorld Bank Group · 2025 · world median 19.1626.1819.16No earlier reading
Croatia: 26.18 · world median 19.16 · Firms with a female top manager (%). World Bank Group, 2025 edition, data for 2025.
Published values in that edition run from 1.429 to 62.9; higher is better.
Position 39th of 179 · derived.
Labour Inspectors per 10,000 Employed PersonsILO · 2024 · world median 0.5751.10.575No earlier reading
Croatia: 1.1 · world median 0.575 · Labour inspectors per 10,000 employed persons. International Labour Organization (ILO), 2024 edition, data for 2024.
Published values in that edition run from 0.07 to 3.89; higher is better.
Unemployment Benefit CoverageILO · 2024 · world median 019.30No earlier reading
Croatia: 19.3 · world median 0 · Unemployed people receiving unemployment benefits (%). International Labour Organization (ILO), 2024 edition, data for 2024.
Published values in that edition run from 0 to 100; higher is better.
Composite Rate of Labour Underutilisation (LU4)ILO · 2024 · world median 12.568.9112.56▲ Improved since 2014
Croatia: 8.91 · world median 12.56 · Composite rate of labour underutilisation, LU4 (% of the extended labour force). International Labour Organization (ILO), 2024 edition, data for 2024.
Published values in that edition run from 1.495 to 49.82; lower is better.
Position 54th of 76 · derived, 1st = worst.
Human Capital Wealth per CapitaWorld Bank Group · 2020 · world median 25,23075,35325,230No real change since 2010
Croatia: 75,353 · world median 25,230 · Human capital per person — present value of future earnings (real chained 2019 US$). World Bank Group, 2020 edition, data for 2020.
Published values in that edition run from 700.38 to 735,422; higher is better.
Position 45th of 151 · derived.
Informal Employment RateILO · 2025 · world median 36.7614.8236.76No earlier reading
Croatia: 14.82 · world median 36.76 · Informal employment (% of total employment). International Labour Organization (ILO), 2025 edition, data for 2025.
Published values in that edition run from 0.857 to 94.44; lower is better.
Position 65th of 97 · derived, 1st = worst.
Firms Competing Against Informal FirmsWorld Bank Group · 2026 · world median 41.8131.9241.81No earlier reading
Croatia: 31.92 · world median 41.81 · Firms competing against unregistered or informal firms (%). World Bank Group, 2026 edition, data for 2026.
Published values in that edition run from 1.926 to 90.5; lower is better.
Position 120th of 181 · derived, 1st = worst.
Compliance with Labour RightsILO · 2024 · world median 1.611.121.61▼ Worsened since 2015
Croatia: 1.12 · world median 1.61 · Compliance with freedom of association and collective bargaining rights (0 = best, 10 = worst). International Labour Organization (ILO), 2024 edition, data for 2024.
Published values in that edition run from 0 to 10; lower is better.
Trade Union DensityILO · 2020 · world median 16.6820.7616.68No earlier reading
Croatia: 20.76 · world median 16.68 · Employees who are trade union members (%). International Labour Organization (ILO), 2020 edition, data for 2020.
Published values in that edition run from 0.2 to 91.42; higher is better.
Position 54th of 139 · derived.
Gini Index of Monthly EarningsILO · 2024 · world median 0.3370.3320.337▼ Worsened since 2014
Croatia: 0.332 · world median 0.337 · Gini index of employees’ monthly earnings (0 = all paid the same, 1 = maximum inequality). International Labour Organization (ILO), 2024 edition, data for 2024.
Published values in that edition run from 0.182 to 0.643; lower is better.
Position 40th of 75 · derived, 1st = worst.
Behind the world median6
Statistics on which Croatia does worse than the middle country measured.
Fatal Occupational InjuriesILO · 2023 · world median 2.0052.582.005▼ Worsened since 2013
Croatia: 2.58 · world median 2.005 · Fatal occupational injuries per 100,000 workers. International Labour Organization (ILO), 2023 edition, data for 2023.
Published values in that edition run from 0.12 to 8.409; lower is better.
Firms Offering Formal TrainingWorld Bank Group · 2026 · world median 32.0724.3832.07No earlier reading
Croatia: 24.38 · world median 32.07 · Firms offering formal training to permanent full-time workers (%). World Bank Group, 2026 edition, data for 2026.
Published values in that edition run from 1.42 to 79.12; higher is better.
Youth Unemployment RateILO · 2025 · world median 12.8316.4712.83▲ Improved since 2015
Croatia: 16.47 · world median 12.83 · Unemployment, ages 15-24 (% of youth labour force). International Labour Organization (ILO), 2025 edition, data for 2025.
Published values in that edition run from 0.457 to 76.77; lower is better.
Position 65th of 182 · derived, 1st = worst.
Female Labour Force Participation RateILO · 2025 · world median 53.3647.3853.36No real change since 2015
Croatia: 47.38 · world median 53.36 · Women aged 15+ in the labour force (%). International Labour Organization (ILO), 2025 edition, data for 2025.
Published values in that edition run from 4.663 to 82.91; higher is better.
Position 128th of 182 · derived.
Labour Force Participation RateILO · 2025 · world median 61.6652.1461.66No real change since 2015
Croatia: 52.14 · world median 61.66 · Population aged 15+ in the labour force (%). International Labour Organization (ILO), 2025 edition, data for 2025.
Published values in that edition run from 23.34 to 87.01; higher is better.
Position 149th of 182 · derived.
Female Share of Senior and Middle ManagementILO · 2024 · world median 35.8625.5235.86▼ Worsened since 2014
Croatia: 25.52 · world median 35.86 · Women in senior and middle management (% of managers). International Labour Organization (ILO), 2024 edition, data for 2024.
Published values in that edition run from 7.226 to 56.69; higher is better.
Position 74th of 86 · derived.
No better end8
These describe the shape of a country — more is not better or worse, only different — so they are never ahead or behind.
Statutory Minimum WageILO · 2024 · world median 657.951,700657.95Moved since 2014
Croatia: 1,700 · world median 657.95 · Statutory minimum wage per month (2021 PPP $). International Labour Organization (ILO), 2024 edition, data for 2024.
Published values in that edition run from 4.038 to 3,804.
Employment in IndustryILO · 2025 · world median 18.8826.3618.88Moved since 2015
Croatia: 26.36 · world median 18.88 · Employment in industry (% of total employment). International Labour Organization (ILO), 2025 edition, data for 2025.
Published values in that edition run from 3.103 to 39.44.
Position 32nd of 182 · derived, counted from the highest value.
Public Sector EmploymentWorld Bank Group · 2022 · world median 15.0120.5715.01No earlier reading
Croatia: 20.57 · world median 15.01 · Public sector employment (% of total employment). World Bank Group, 2022 edition, data for 2022.
Published values in that edition run from 1.672 to 47.1.
Position 46th of 135 · derived, counted from the highest value.
Employment in ServicesILO · 2025 · world median 59.5169.3159.51Moved since 2015
Croatia: 69.31 · world median 59.51 · Employment in services (% of total employment). International Labour Organization (ILO), 2025 edition, data for 2025.
Published values in that edition run from 11.56 to 92.17.
Position 62nd of 182 · derived, counted from the highest value.
Share of Temporary EmployeesILO · 2024 · world median 13.459.24213.45Moved since 2014
Croatia: 9.242 · world median 13.45 · Employees on temporary contracts (% of employees). International Labour Organization (ILO), 2024 edition, data for 2024.
Published values in that edition run from 0.337 to 72.78.
Employment in AgricultureILO · 2025 · world median 14.384.32814.38Moved since 2015
Croatia: 4.328 · world median 14.38 · Employment in agriculture (% of total employment). International Labour Organization (ILO), 2025 edition, data for 2025.
Published values in that edition run from 0.095 to 85.34.
Position 133rd of 182 · derived, counted from the highest value.
Average Weekly Hours WorkedILO · 2025 · world median 38.8933.8738.89Moved since 2015
Croatia: 33.87 · world median 38.89 · Average weekly hours actually worked per employed person. International Labour Organization (ILO), 2025 edition, data for 2025.
Published values in that edition run from 23.64 to 54.7.
Position 145th of 182 · derived, counted from the highest value.
Self-Employment RateILO · 2025 · world median 31.8412.7431.84Moved since 2015
Croatia: 12.74 · world median 31.84 · Self-employed (% of total employment). International Labour Organization (ILO), 2025 edition, data for 2025.
Published values in that edition run from 0.832 to 91.56.
Position 151st of 182 · derived, counted from the highest value.
No current reading for Croatia
Low Pay Rate and Working Poverty Rate. Listed rather than hidden, so the page can be checked against it.
“Position · derived” is this site’s ordering of the published values, 1st = best unless the row says otherwise; the publisher ranks no country on it. Rank, position and standing
05Country Index 2026
Work & Labour among Croatia’s 16 topics
Work & Labour is Croatia’s 10th best-placed topic of 16. Strongest first, each marker at its share of that topic’s field.
- Gender & Equality8th of 1834/4 keys
- Education & Knowledge12th of 1983/4 keys
- Food & Agriculture21st of 1844/4 keys
- Health & Wellbeing29th of 2003/4 keys
- Development & Human Capital30th of 1963/3 keys
- Energy27th of 1653/3 keys
- Economy & Innovation35th of 1764/4 keys
- Poverty & Inequality32nd of 1593/3 keys
- Governance & Institutions39th of 1944/4 keys
- Work & Labour41st of 1824/4 keys
- Democracy & Civil Liberties53rd of 1984/4 keys
- Mobility & Trade53rd of 1774/4 keys
- Peace & Security56th of 1774/4 keys
- Risk & Resilience69th of 1934/4 keys
- Digital & Technology76th of 1984/4 keys
- Environment & Sustainability82nd of 1864/4 keys
06The top of the list
Who leads on work & labour
The three countries placed highest of 182, and the leaders Croatia can most readily be measured against.
 1
 Iceland
Northern Europe
1st of 182 · 4 of 4 keys
Photo: Hansueli Krapf · CC BY-SA 3.0, greyscale
 2
 Japan
Eastern Asia
2nd of 182 · 4 of 4 keys
Photo: JurriaanH · CC BY-SA 3.0, greyscale
 3
 South Korea
Eastern Asia
3rd of 182 · 4 of 4 keys
Photo: Unknown author · CC BY-SA 2.0, greyscale
Placed highest nearby
Highest in Europe
Iceland1st4/4 keysHighest in Southern Europe
Slovenia18th4/4 keysThis page
Croatia41st4/4 keys
Positions out of 182 placed on the topic. A country needs readings on enough keys to be placed, and the top of the list is often held on fewer of them.
07Analysis
Charts and analysis about Croatia and work & labour
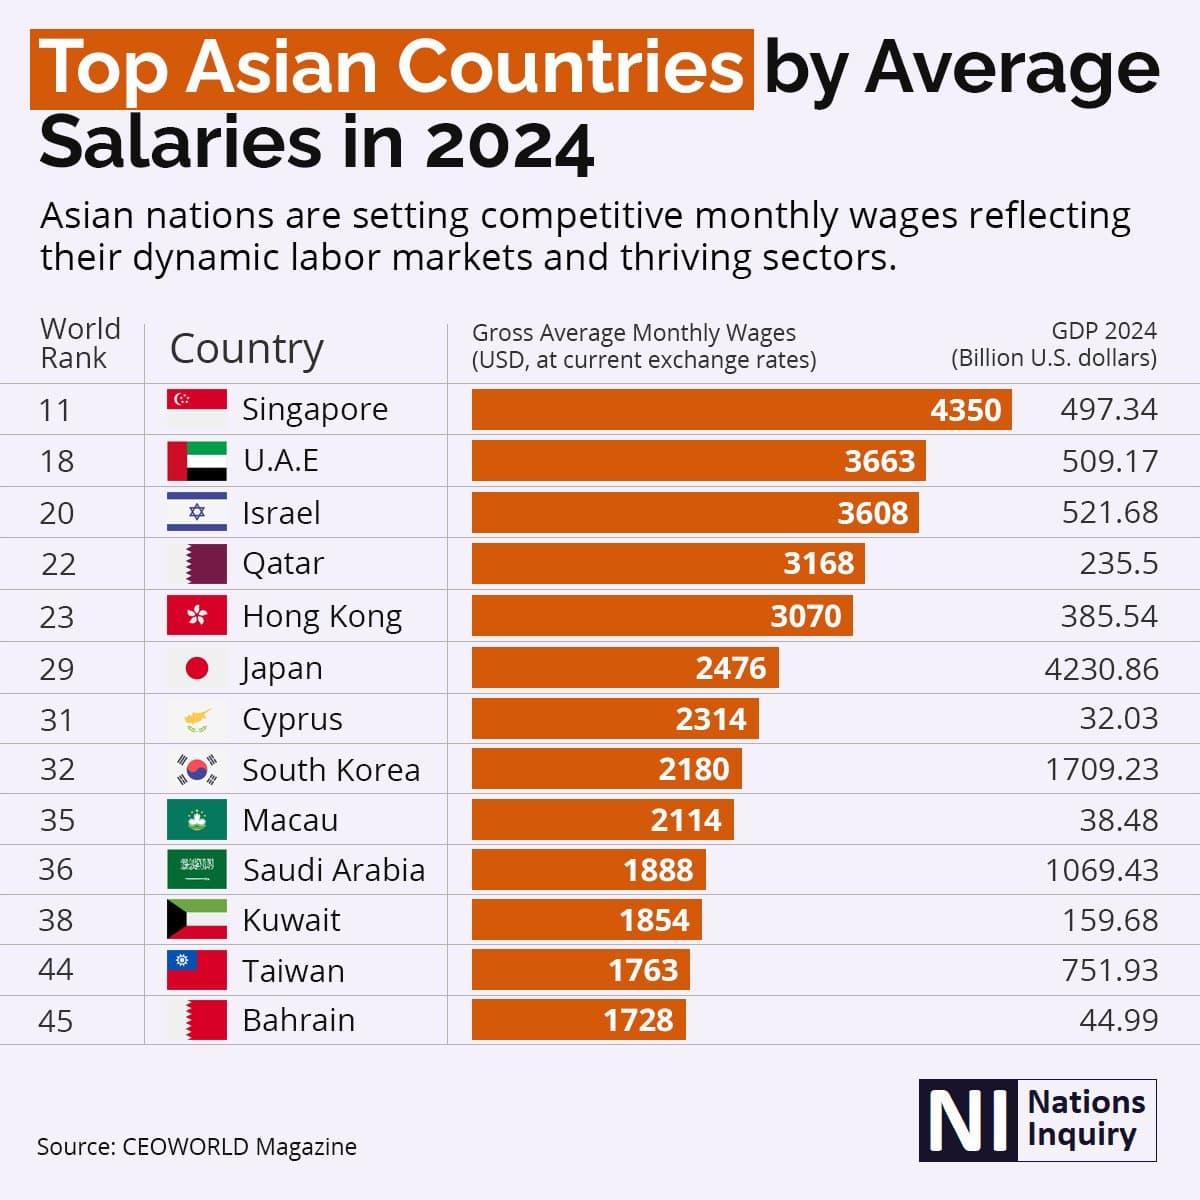
On work & labour
Countries in Asia with the highest average salaries 2024
Thirteen Asian countries by gross average monthly wage, each carrying its WORLD rank rather than an Asian one — so the numbers skip, from 11th place to 45th.

On work & labour
Countries With The Highest Average Salaries in 2024
The ten highest-paying countries of 2024, their bars coloured by continent, and six more added for comparison — from Australia in 13th place to India in 85th.

On work & labour
Countries With The Lowest Average Salaries in 2024
The bottom ten of 196 countries, and six more added for comparison. Niger, Madagascar and Liberia are all published at US$47 a month and still carry three different ranks.
08Questions
Croatia on work & labour: questions answered
Every answer is built from the numbers on this page, so none can say something the page does not.
How does Croatia rank on work & labour?
Croatia is placed 41st of 182 countries on Work & Labour in the Country Index 2026, from 4 of its 4 key statistics (Employment-to-Population Ratio, Labour Income Share, Unemployment Rate and Vulnerable Employment). The position is this site’s ordering of published statistics, not a rank any publisher printed.
What is the latest Employment-to-Population Ratio figure for Croatia?
49.53 in 2025 (employed share of the population aged 15+ (%)), according to International Labour Organization (ILO). The world median in the same edition was 57.72.
What is the latest Labour Income Share figure for Croatia?
62.91 in 2025 (labour income share of GDP (%)), according to International Labour Organization (ILO). The world median in the same edition was 46.23.
How does Croatia compare with Hungary on work & labour?
Hungary is placed joint 39th of 182, and Croatia 41st. Employment-to-Population Ratio: Hungary 57.84, Croatia 49.53; Labour Income Share: Hungary 51.3, Croatia 62.91; Unemployment Rate: Hungary 4.521, Croatia 5.002; Vulnerable Employment: Hungary 7.829, Croatia 6.346.
How have Croatia’s work & labour figures changed?
Employment-to-Population Ratio rose from 44.18 in 2000 to 49.53 in 2025; Labour Income Share rose from 60.93 in 2004 to 62.91 in 2025; Unemployment Rate fell from 16.06 in 2000 to 5.002 in 2025; Vulnerable Employment fell from 18.76 in 2000 to 6.346 in 2025.
Which work & labour statistics are missing for Croatia?
No current reading is published for Croatia on Low Pay Rate and Working Poverty Rate. They are listed rather than hidden, so the evidence on the page can be checked against it.
09Method
Method, sources and how to cite
What this topic does not measure
Wages in money terms are not a key here, because pay figures are hard to compare fairly across countries with very different prices. Labour productivity, working hours, youth unemployment and the balance between farming, industry and services are published on this page as context. The size and growth of the wider economy belong to Economy & Innovation.
How the Work & Labour standing is decided
A standing is this site’s ordering, named with its edition — never a publisher’s rank. 4 key statistics vote, one vote each; every country’s published value becomes a place within that key’s own field, the places are averaged, and the average is never published. A country needs 2 of the 4 keys to be placed.
The work & labour method, step by stepHow every standing on this site is built
The key statistics and their licences
- Employment-to-Population Ratio — International Labour Organization (ILO), CC BY 4.0
- Labour Income Share — International Labour Organization (ILO), CC BY 4.0
- Unemployment Rate — International Labour Organization (ILO), CC BY 4.0
- Vulnerable Employment — International Labour Organization (ILO), CC BY 4.0
The other 32 statistics on this page come from 2 publishers, each named beside its numbers, with every edition and licence on the datasets pages.
The standing itself is part of the Country Index 2026, published under CC BY-SA 4.0.
Photographs
Croatia’s banner and the countries placed highest, from their profiles: Wikimedia Commons, shown in greyscale, each used under the licence named.
- Croatia (banner) — Wolfgang Steinkläubl, CC BY-SA 3.0
- Iceland — Hansueli Krapf, CC BY-SA 3.0
- Japan — JurriaanH, CC BY-SA 3.0
- South Korea — Unknown author, CC BY-SA 2.0
Cite this page
Nations Inquiry (2026). Croatia: Work & Labour — standing and statistics, Country Index 2026. https://nationsinquiry.com/countries/croatia/work