Data for 2005
Qualified Teachers in Primary Education, 2005
Figures for 2005, as UIS published them · stored as published, never rewritten
This is the share of primary-school teachers who hold at least the minimum qualification their own country requires of them — SDG indicator 4.c.1. It describes the teaching workforce rather than the pupils.
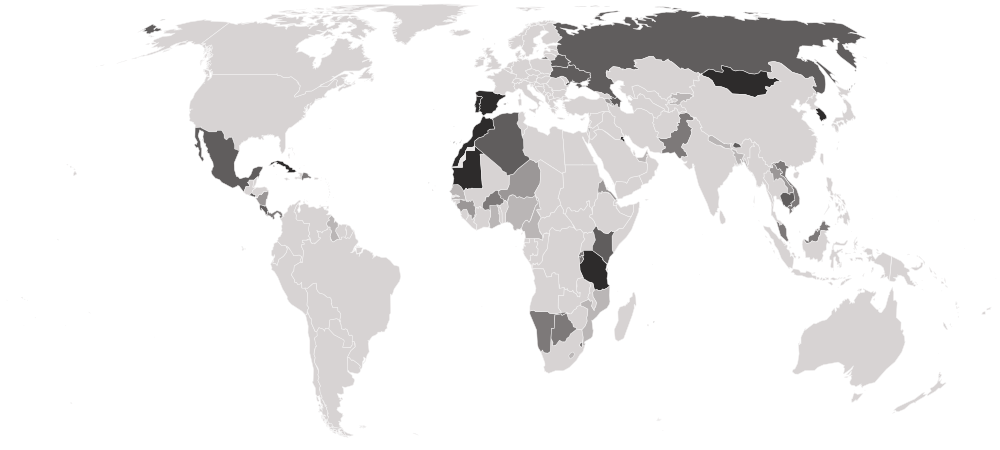
Qualified Teachers in Primary Education, 2005 covers 66 countries on 3 measures. 13 countries share the highest reading, 100.00; Nepal is lowest, at 30.51. The middle country reads 90.79. Against 2004, 39 values changed (26 up, 13 down), 15 countries joined, 10 left.
Qualified Teachers in Primary Education · Data for 2005
Highest13 countries share it
100.00
LowestNepal
30.51Shaded by value in five groups of equal size, darkest at the better end.
01Values only
The table
Every country and every column of Qualified Teachers in Primary Education, 2005, as published. The file carries values only, so no position is shown. “=” marks a shared position.
Showing 25 of 66 countries · select a heading to sort
 Aruba ABWCaribbean | 100.00 | 100.00 | 100.00 |
 Bermuda BMUNorthern America | 100.00 | 100.00 | 100.00 |
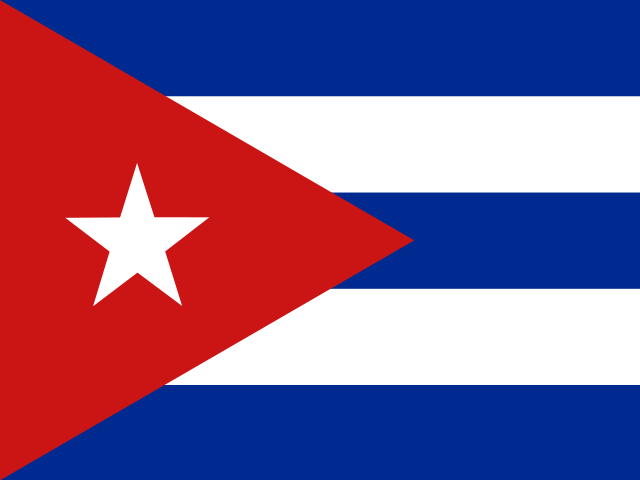 Cuba CUBCaribbean | 100.00 | 100.00 | 100.00 |
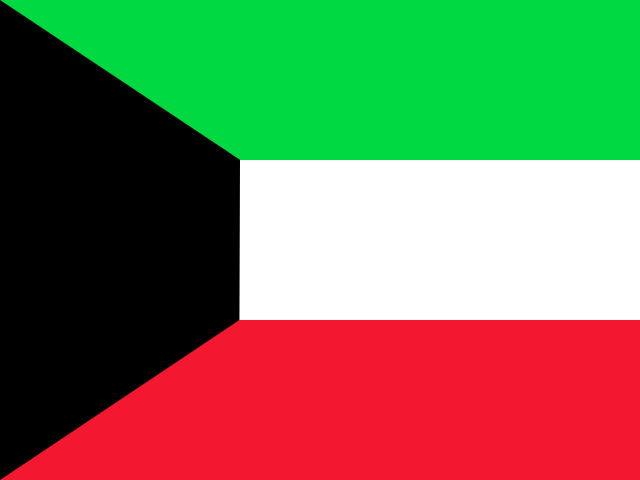 Kuwait KWTWestern Asia | 100.00 | 100.00 | 100.00 |
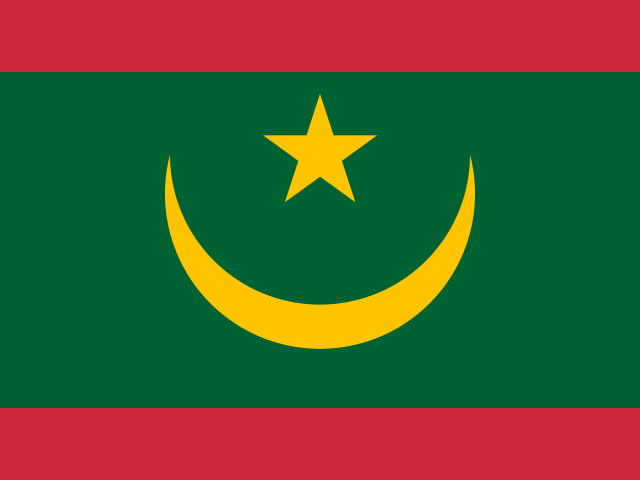 Mauritania MRTWestern Africa | 100.00 | 100.00 | 100.00 |
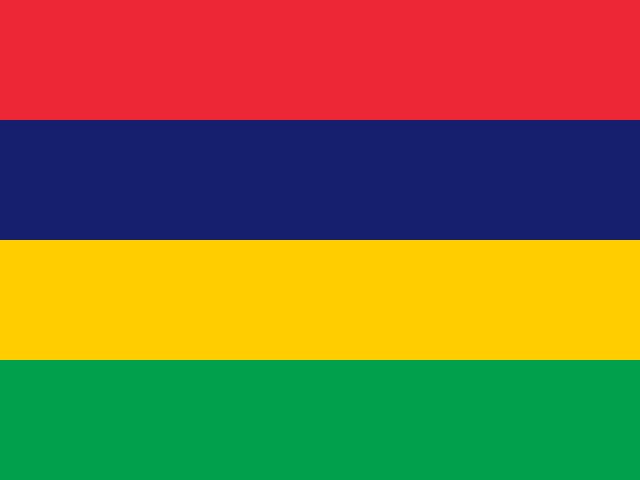 Mauritius MUSEastern Africa | 100.00 | 100.00 | 100.00 |
 Mongolia MNGEastern Asia | 100.00 | 100.00 | 100.00 |
 Morocco MARNorthern Africa | 100.00 | 100.00 | 100.00 |
 Palestine PSEWestern Asia | 100.00 | 100.00 | 100.00 |
 Portugal PRTSouthern Europe | 100.00 | 100.00 | 100.00 |
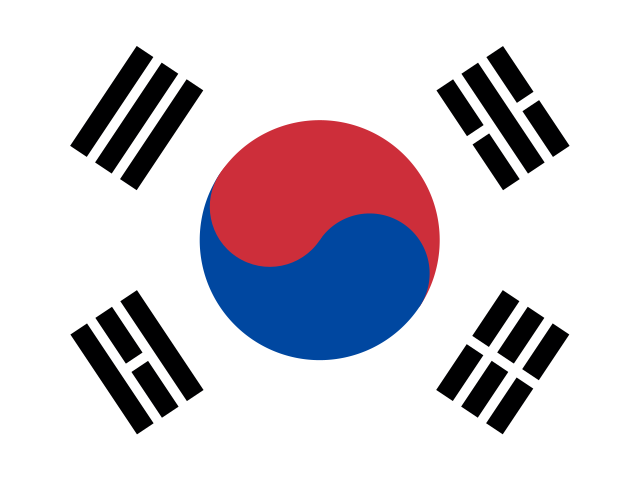 South Korea KOREastern Asia | 100.00 | 100.00 | 100.00 |
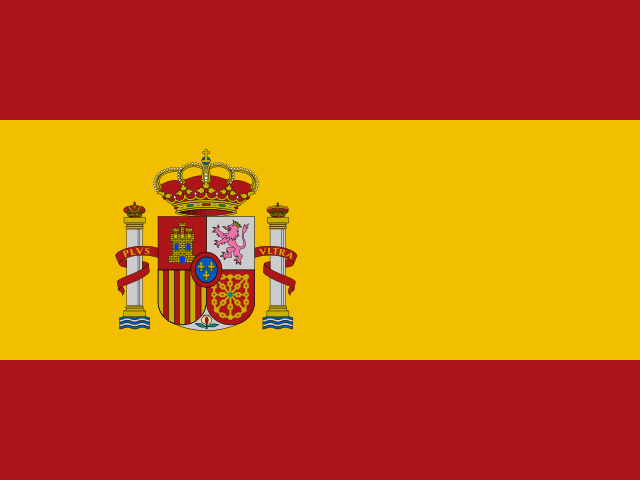 Spain ESPSouthern Europe | 100.00 | 100.00 | 100.00 |
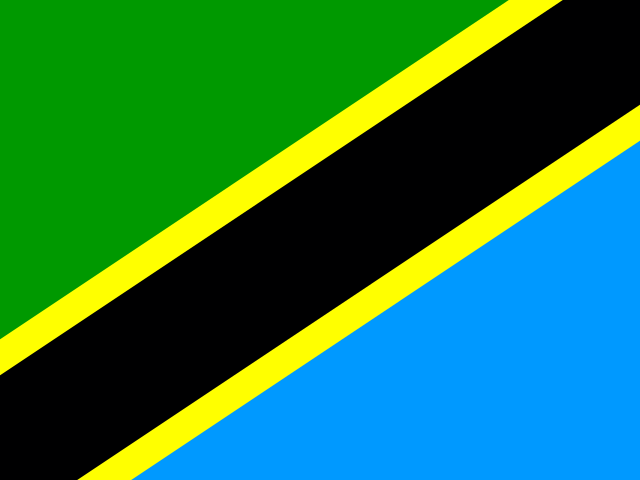 Tanzania TZAEastern Africa | 100.00 | 100.00 | 100.00 |
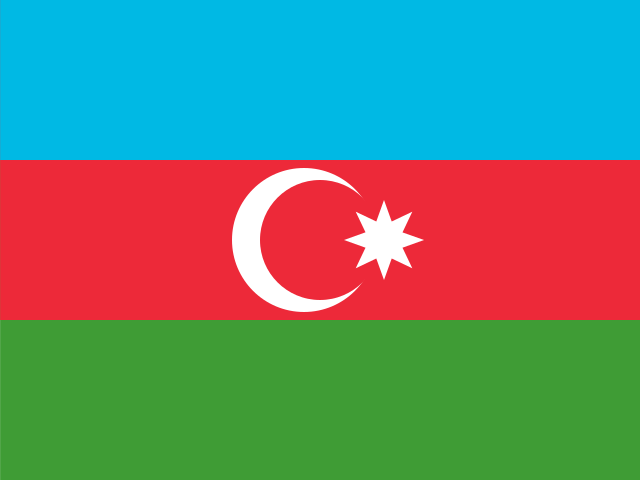 Azerbaijan AZEWestern Asia | 99.98 | 99.99 | 99.90 |
 Belarus BLREastern Europe | 99.80 | 99.80 | 100.00 |
 Ukraine UKREastern Europe | 99.69 | — | — |
 Kenya KENEastern Africa | 98.91 | 99.24 | 98.66 |
 Cayman Islands CYMCaribbean | 98.81 | 98.66 | 100.00 |
 Algeria DZANorthern Africa | 98.53 | 98.95 | 98.10 |
 Cambodia KHMSouth-eastern Asia | 97.69 | — | — |
 Costa Rica CRICentral America | 96.79 | 96.81 | 96.70 |
 Russia RUSEastern Europe | 96.27 | — | — |
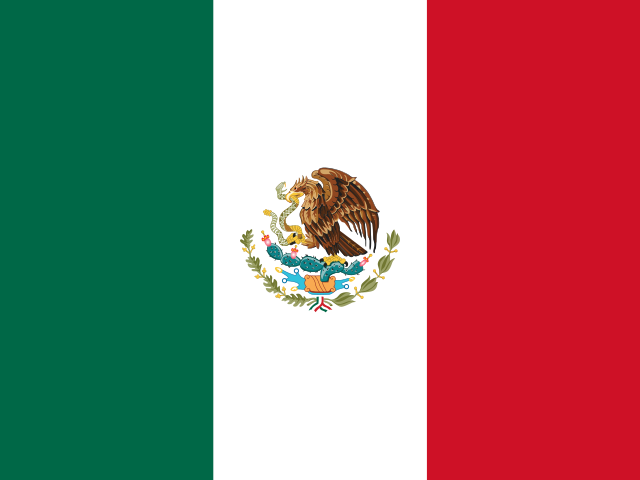 Mexico MEXCentral America | 94.93 | — | — |
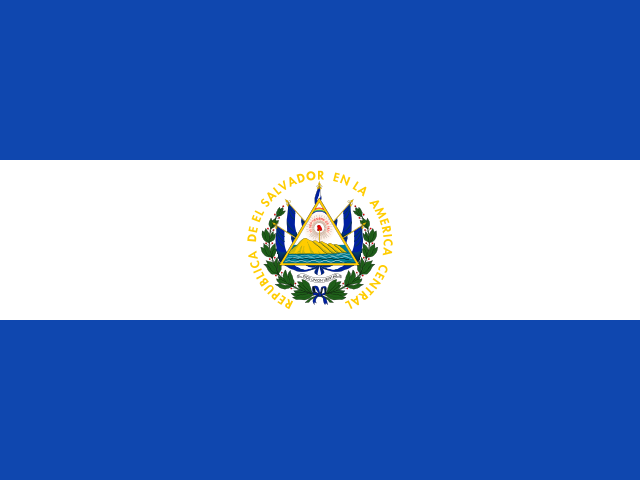 El Salvador SLVCentral America | 94.87 | 95.65 | 92.89 |
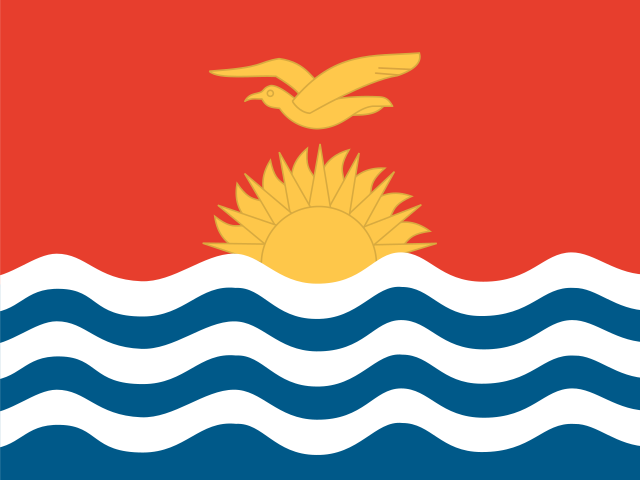 Kiribati KIRMicronesia | 93.88 | 95.05 | 90.53 |
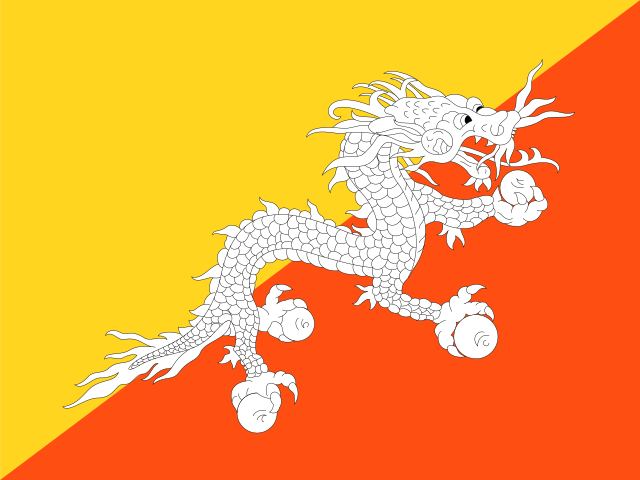 Bhutan BTNSouthern Asia | 93.82 | 94.69 | 93.28 |
 Rwanda RWAEastern Africa | 93.73 | 93.89 | 93.54 |
 Vietnam VNMSouth-eastern Asia | 93.37 | — | — |
 Hong Kong HKGEastern Asia | 93.16 | 93.30 | 92.68 |
 Botswana BWASouthern Africa | 92.59 | 91.99 | 94.66 |
 Namibia NAMSouthern Africa | 92.43 | 96.99 | 83.23 |
 Malaysia MYSSouth-eastern Asia | 91.89 | 90.42 | 94.69 |
 Macau MACEastern Asia | 90.80 | 92.78 | 75.41 |
 Eswatini SWZSouthern Africa | 90.77 | 91.36 | 89.19 |
 Panama PANCentral America | 89.65 | 88.78 | 92.46 |
 Dominican Republic DOMCaribbean | 88.27 | 90.48 | 81.26 |
 Burkina Faso BFAWestern Africa | 88.26 | 91.35 | 86.99 |
 Burundi BDIEastern Africa | 87.51 | 90.88 | 83.32 |
 Pakistan PAKSouthern Asia | 85.51 | 75.71 | 93.81 |
 Niger NERWestern Africa | 85.00 | — | — |
 Brunei BRNSouth-eastern Asia | 84.45 | 82.11 | 90.24 |
 Eritrea ERIEastern Africa | 83.61 | 71.19 | 91.83 |
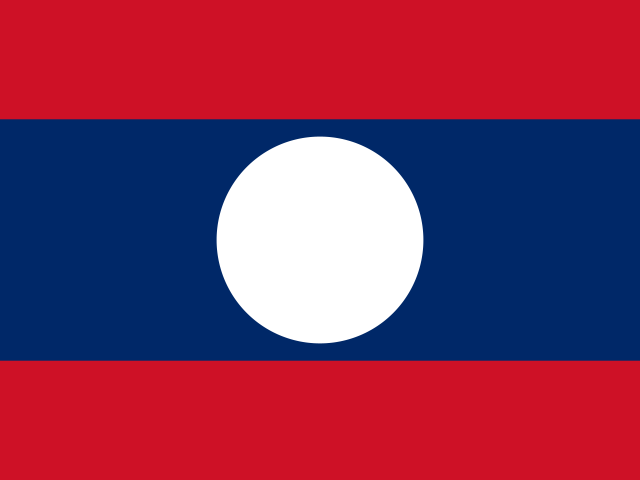 Laos LAOSouth-eastern Asia | 83.38 | 89.44 | 78.34 |
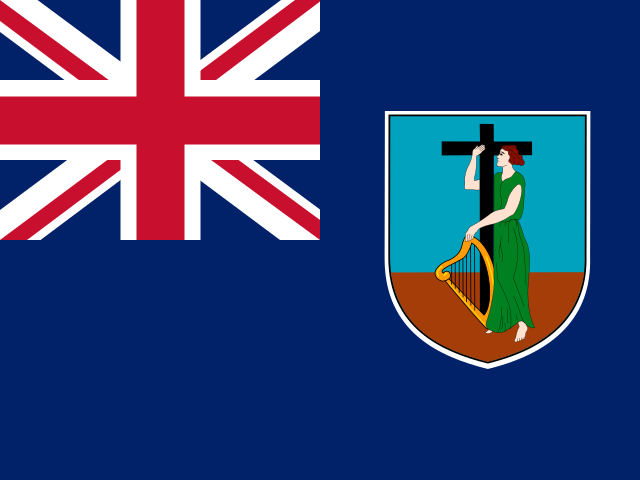 Montserrat MSRCaribbean | 80.00 | 80.00 | — |
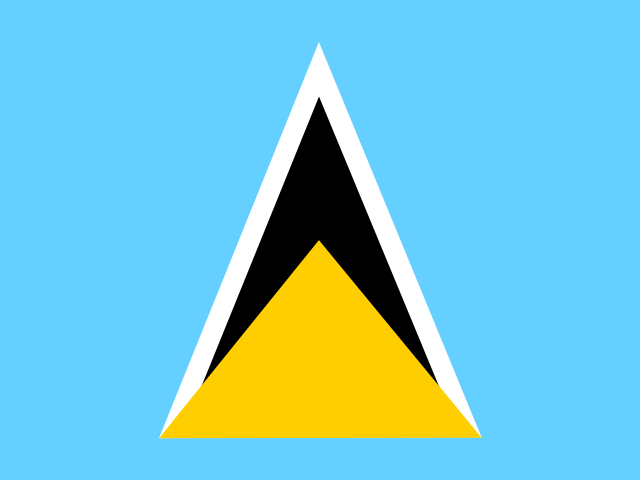 Saint Lucia LCACaribbean | 79.96 | 81.13 | 72.85 |
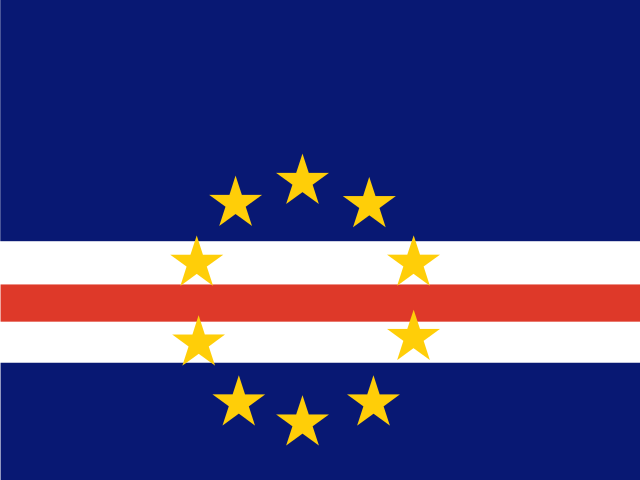 Cabo Verde CPVWestern Africa | 77.81 | 81.35 | 70.91 |
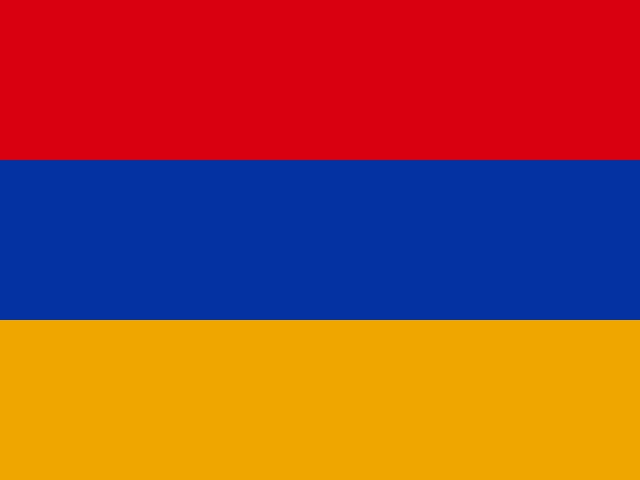 Armenia ARMWestern Asia | 77.46 | 77.92 | 22.45 |
 Nicaragua NICCentral America | 76.94 | 82.21 | 57.76 |
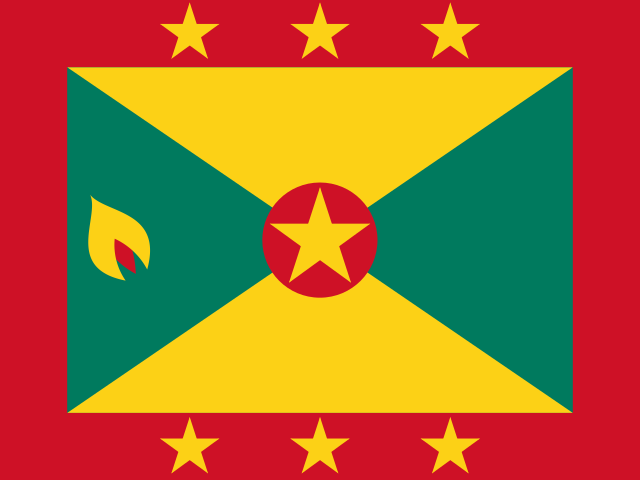 Grenada GRDCaribbean | 75.35 | 76.11 | 72.83 |
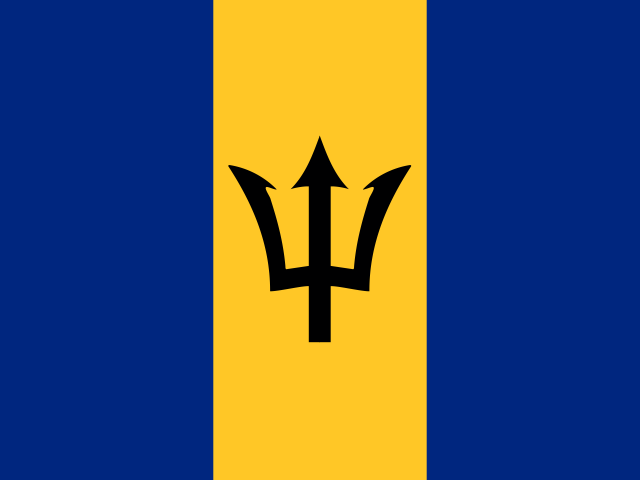 Barbados BRBCaribbean | 73.25 | 72.02 | 77.51 |
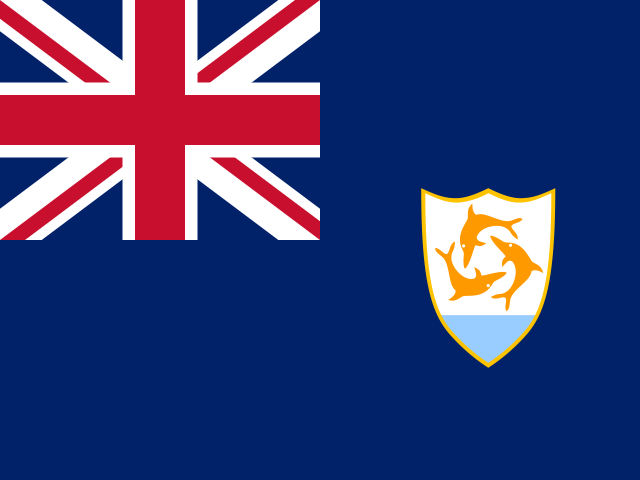 Anguilla AIACaribbean | 68.09 | 73.81 | 20.00 |
 Guinea GINWestern Africa | 68.08 | 68.07 | 68.08 |
 Maldives MDVSouthern Asia | 64.30 | 66.27 | 60.43 |
 Lesotho LSOSouthern Africa | 63.68 | 68.75 | 45.48 |
 Cameroon CMRMiddle Africa | 62.74 | 68.06 | 59.20 |
 United Arab Emirates AREWestern Asia | 59.97 | 58.36 | 68.68 |
 Dominica DMACaribbean | 59.92 | 62.59 | 44.87 |
 Mozambique MOZEastern Africa | 59.83 | 67.40 | 56.60 |
 Saint Kitts and Nevis KNACaribbean | 58.33 | 56.96 | 66.67 |
 Kyrgyzstan KGZCentral Asia | 57.96 | 57.96 | 58.03 |
 Ghana GHAWestern Africa | 57.88 | 77.77 | 48.90 |
 Guyana GUYSouth America | 57.20 | 58.04 | 51.87 |
 Bangladesh BGDSouthern Asia | 53.40 | 54.40 | 52.81 |
 Nigeria NGAWestern Africa | 49.97 | 60.59 | 38.97 |
 Senegal SENWestern Africa | 45.70 | 41.68 | 47.05 |
NepalNPLSouthern Asia | 30.51 | 27.04 | 32.01 |
02In 2005
At either end
The 5 countries at each end of the headline, then the highest and lowest on each other measure.
Highest
- Arubashared100.00
- Bermudashared100.00
- Cubashared100.00
- Spainshared100.00
- South Koreashared100.00
Lowest
- Nepal30.51
- Senegal45.70
- Nigeria49.97
- Bangladesh53.40
- Guyana57.20
A higher value is the better result. The middle country reads 90.79. “Shared” marks a value another country also holds.
Each measure’s ends
032004 → 2005
Since 2004
- +15 / −10countries joined / left
- 39values changed, of 51 in both
- 26 · 13rose · fell
- 12unchanged
Rose most
Fell most
- Ghana67.96 → 57.88−10.09
- Montserrat86.36 → 80.00−6.36
- Cameroon68.53 → 62.74−5.79
- Senegal50.84 → 45.70−5.14
- Dominica63.58 → 59.92−3.66
+ Burundi+ Bangladesh+ Barbados+ Brunei+ Bhutan+ Dominican Republic+ Guinea+ Grenada+ Guyana+ Kiribati+ Morocco+ Maldives+ Mozambique+ Russia+ Vietnam − Benin
 − Bahamas
 − Belize
 − Republic of the Congo
 − Honduras
 − Iraq
 − Myanmar
 − Tajikistan
 − Trinidad and Tobago
 − Saint Vincent and the Grenadines
Changes in value, not in places: a country’s place also moves when others do.
04Caveats
Read before you use
54 distinct values among 66
Values are stored exactly as published, to 14 decimals. 13 countries share 100.00. Countries sharing a value share a position too.
13 empty cells
An empty cell means the publisher gave no figure. It is never a zero.
05The files
Download and cite
- .csv
For a spreadsheet or code
66 rows · 4.9 KB · UTF-8, opens in Excel
Opens with 11 lines of source notes; the table starts on row 13.
Download qualified-teachers-primary-2005-nations-inquiry.csv - ↗
The publisher’s original
UIS’s own file, on its own site.
indicators
What this site changed: Reshaped to one row per country, with its ISO code; no value recalculated, rescaled or rounded. In full
Licence: CC BY-SA 4.0 · what it allows, in plain words
Cite this edition
UNESCO Institute for Statistics (UIS) (2005). Qualified Teachers in Primary Education, 2005 [data set], describing 2005. As held by Nations Inquiry, https://nationsinquiry.com/datasets/qualified-teachers-primary/2005
0625 held
Other years
‹ The year before
Qualified Teachers in Primary Education, 200461 countries
The year after ›
Qualified Teachers in Primary Education, 200667 countries
All of them
Qualified Teachers in Primary Education: every year25 held, with the data dictionary, coverage and licence.
How it has moved, charted by country