Data for 2022
Share of Graduates from ICT Programmes, 2022
Figures for 2022, as UIS published them · stored as published, never rewritten
This is the share of a country's university and college graduates whose degree was in information and communication technologies. It describes how much of a higher-education system is training people to build and run digital systems.
Share of Graduates from ICT Programmes, 2022 covers 92 countries on 3 measures. Tunisia is highest, at 13.656; 2 countries share the lowest reading, 0.000. The middle country reads 5.218. Against 2021, 82 values changed (55 up, 27 down), 9 countries joined, 12 left.
Share of Graduates from ICT Programmes · Data for 2022
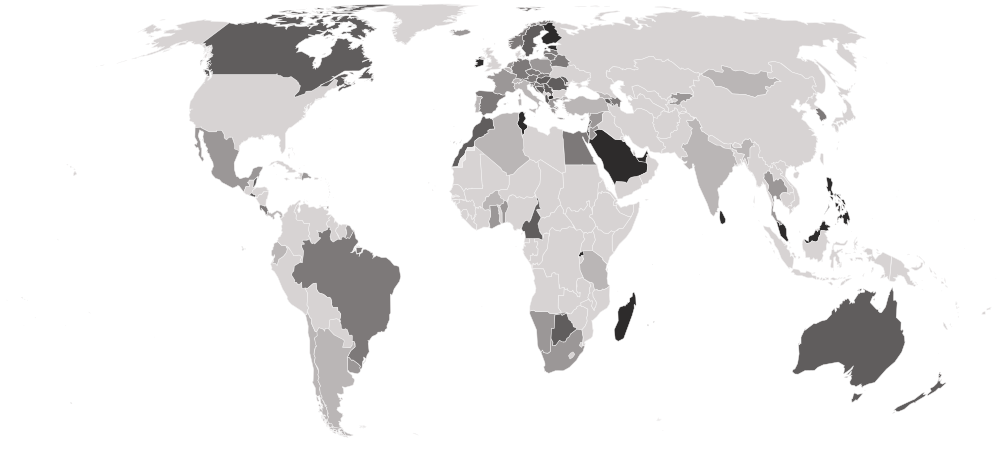
HighestTunisia
13.656Lowest2 countries share it
0.000Shaded by value in five groups of equal size, darkest at the highest end.
01Values only
The table
Every country and every column of Share of Graduates from ICT Programmes, 2022, as published. The file carries values only, so no position is shown. “=” marks a shared position.
Showing 25 of 92 countries · select a heading to sort
TunisiaTUNNorthern Africa | 13.656 | 10.416 | 20.114 |
 Andorra ANDSouthern Europe | 13.636 | 3.125 | 28.261 |
 Rwanda RWAEastern Africa | 10.923 | 9.562 | 12.026 |
 Mauritius MUSEastern Africa | 10.593 | 6.851 | 15.963 |
 Singapore SGPSouth-eastern Asia | 10.042 | 5.809 | 14.602 |
 Saudi Arabia SAUWestern Asia | 9.899 | 7.876 | 12.105 |
 British Virgin Islands VGBCaribbean | 9.612 | 12.500 | 4.367 |
 Estonia ESTNorthern Europe | 9.588 | 5.096 | 17.340 |
 United Arab Emirates AREWestern Asia | 8.807 | 8.423 | 9.151 |
 Luxembourg LUXWestern Europe | 8.615 | 3.723 | 13.967 |
 Seychelles SYCEastern Africa | 8.500 | 2.672 | 19.565 |
 Ireland IRLNorthern Europe | 8.195 | 4.710 | 12.719 |
 Finland FINNorthern Europe | 8.053 | 3.483 | 15.235 |
 Madagascar MDGEastern Africa | 7.934 | 5.657 | 10.365 |
 Sri Lanka LKASouthern Asia | 7.910 | 5.207 | 12.491 |
 North Macedonia MKDSouthern Europe | 7.874 | 5.265 | 11.418 |
 Malaysia MYSSouth-eastern Asia | 7.652 | 5.834 | 9.732 |
 Philippines PHLSouth-eastern Asia | 7.582 | 5.249 | 11.167 |
 El Salvador SLVCentral America | 7.443 | 4.597 | 11.116 |
 Botswana BWASouthern Africa | 7.316 | 6.046 | 9.557 |
 Armenia ARMWestern Asia | 7.225 | 4.195 | 11.175 |
 Serbia SRBSouthern Europe | 7.185 | 4.185 | 11.902 |
 Israel ISRWestern Asia | 6.942 | 4.329 | 11.041 |
 Hungary HUNEastern Europe | 6.800 | 2.007 | 13.527 |
 Romania ROUEastern Europe | 6.775 | 4.027 | 10.889 |
 Sweden SWENorthern Europe | 6.766 | 3.690 | 11.727 |
 New Zealand NZLAustralia and New Zealand | 6.597 | 3.431 | 12.057 |
 Morocco MARNorthern Africa | 6.509 | 4.429 | 9.118 |
 Bosnia and Herzegovina BIHSouthern Europe | 6.290 | 3.186 | 11.235 |
 Moldova MDAEastern Europe | 6.265 | 2.239 | 11.986 |
 Cameroon CMRMiddle Africa | 6.209 | 3.932 | 8.449 |
 Australia AUSAustralia and New Zealand | 6.157 | 2.819 | 10.739 |
 Albania ALBSouthern Europe | 6.076 | 3.831 | 10.488 |
 Belize BLZCentral America | 6.066 | 2.560 | 12.817 |
 Canada CANNorthern America | 6.061 | 2.777 | 10.493 |
 Lebanon LBNWestern Asia | 5.878 | — | — |
 Azerbaijan AZEWestern Asia | 5.833 | 4.058 | 7.995 |
 Malta MLTSouthern Europe | 5.757 | 1.645 | 10.898 |
 Norway NORNorthern Europe | 5.566 | 2.444 | 9.920 |
 Costa Rica CRICentral America | 5.488 | 2.163 | 10.415 |
 Czechia CZEEastern Europe | 5.483 | 1.571 | 11.516 |
 Germany DEUWestern Europe | 5.477 | 2.361 | 8.703 |
 Latvia LVANorthern Europe | 5.431 | 1.857 | 12.307 |
 Egypt EGYNorthern Africa | 5.307 | 2.559 | 8.511 |
 Austria AUTWestern Europe | 5.263 | 1.626 | 9.741 |
 Spain ESPSouthern Europe | 5.233 | 1.257 | 10.384 |
 Croatia HRVSouthern Europe | 5.202 | 2.225 | 9.790 |
 Belarus BLREastern Europe | 5.195 | 2.628 | 8.201 |
 Lithuania LTUNorthern Europe | 4.994 | 1.511 | 10.926 |
 South Korea KOREastern Asia | 4.903 | 2.727 | 7.266 |
 Palestine PSEWestern Asia | 4.894 | 3.909 | 6.599 |
 Slovakia SVKEastern Europe | 4.784 | 1.339 | 10.233 |
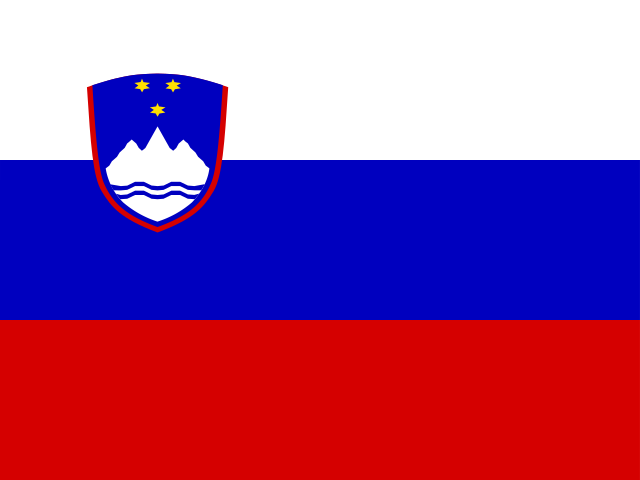 Slovenia SVNSouthern Europe | 4.755 | 1.590 | 9.373 |
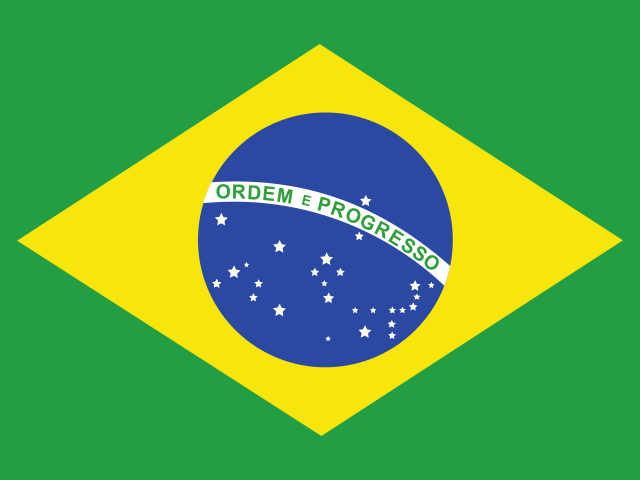 Brazil BRASouth America | 4.621 | 1.178 | 9.900 |
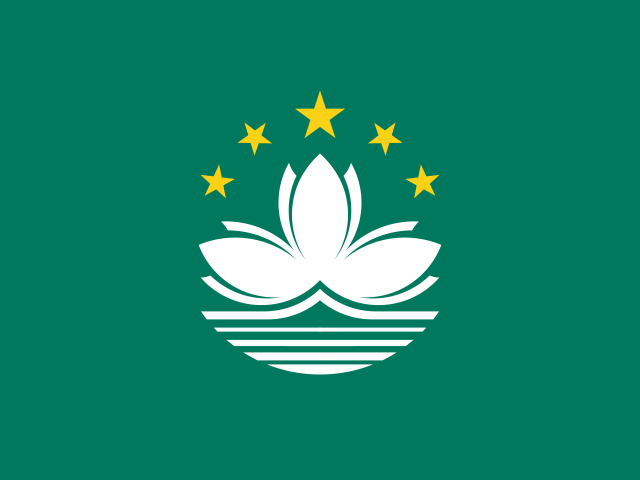 Macau MACEastern Asia | 4.594 | 1.793 | 8.749 |
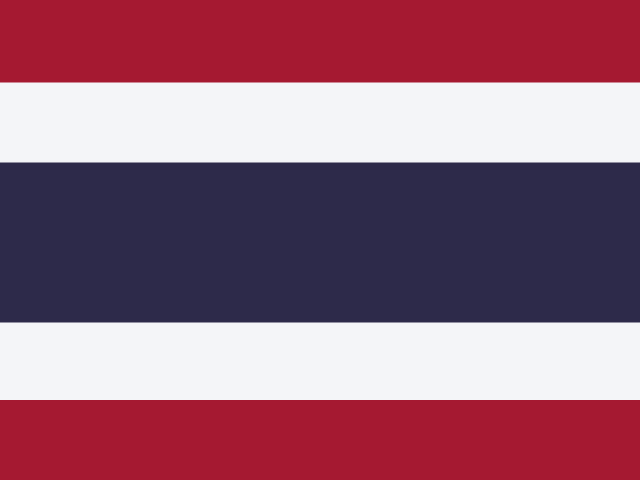 Thailand THASouth-eastern Asia | 4.578 | 3.213 | 6.295 |
 Dominican Republic DOMCaribbean | 4.566 | 1.267 | 12.001 |
 Netherlands NLDWestern Europe | 4.430 | 1.512 | 8.274 |
 Ghana GHAWestern Africa | 4.409 | 1.654 | 6.585 |
 South Africa ZAFSouthern Africa | 4.290 | 2.882 | 6.744 |
 Poland POLEastern Europe | 4.258 | 1.437 | 9.552 |
 Mexico MEXCentral America | 4.238 | 2.054 | 7.026 |
 Syria SYRWestern Asia | 4.140 | 3.774 | 4.757 |
 Uruguay URYSouth America | 4.072 | 1.514 | 8.990 |
 Kyrgyzstan KGZCentral Asia | 4.067 | 3.026 | 5.537 |
 France FRAWestern Europe | 4.060 | 1.313 | 7.630 |
 Jordan JORWestern Asia | 4.050 | 3.898 | 4.276 |
 Iceland ISLNorthern Europe | 4.021 | 1.543 | 9.247 |
 Namibia NAMSouthern Africa | 3.968 | 2.102 | 8.050 |
 Bahrain BHRWestern Asia | 3.955 | 2.533 | 6.377 |
 Trinidad and Tobago TTOCaribbean | 3.678 | 2.012 | 6.463 |
 Greece GRCSouthern Europe | 3.628 | 2.104 | 5.905 |
 Benin BENWestern Africa | 3.603 | 2.069 | 4.579 |
 Qatar QATWestern Asia | 3.564 | 2.621 | 5.871 |
 Panama PANCentral America | 3.515 | 1.674 | 7.148 |
 Tanzania TZAEastern Africa | 3.292 | 2.075 | 4.321 |
 Switzerland CHEWestern Europe | 3.211 | 0.798 | 5.692 |
 Chile CHLSouth America | 3.187 | 0.734 | 6.487 |
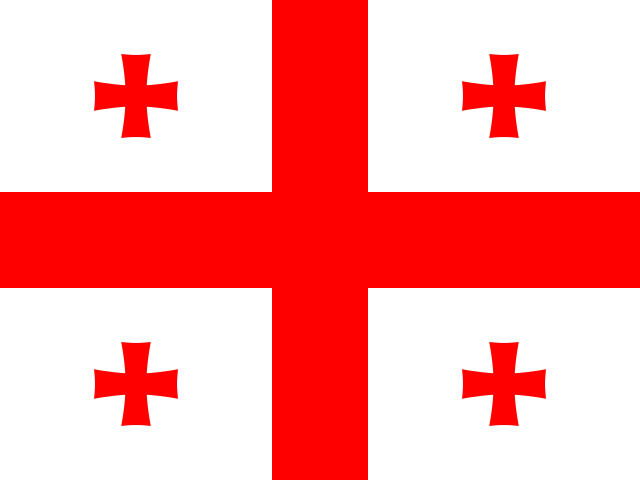 Georgia GEOWestern Asia | 3.020 | 1.139 | 5.557 |
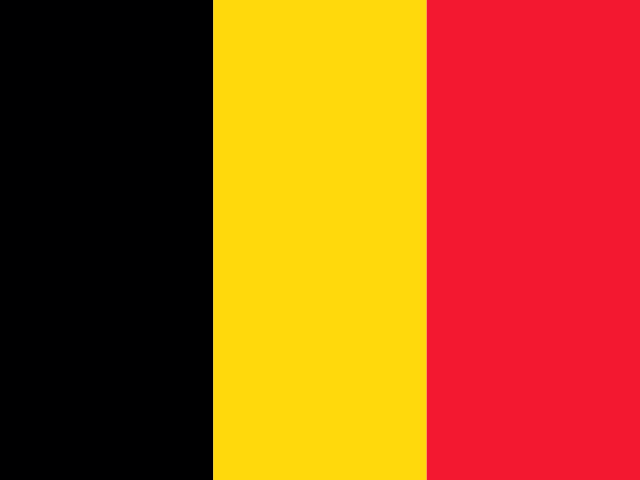 Belgium BELWestern Europe | 2.983 | 0.677 | 6.421 |
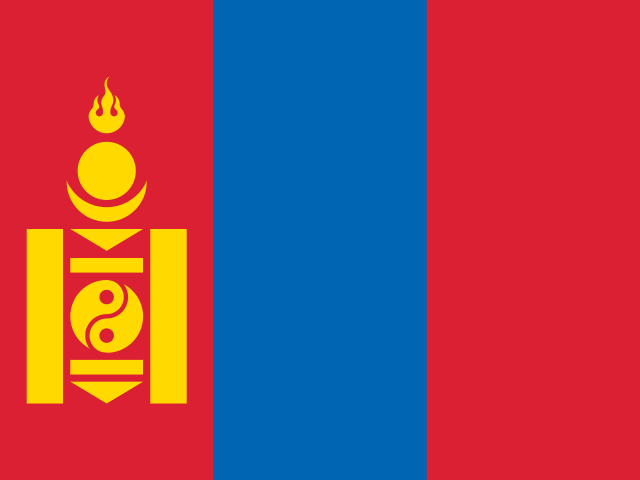 Mongolia MNGEastern Asia | 2.960 | 1.449 | 5.671 |
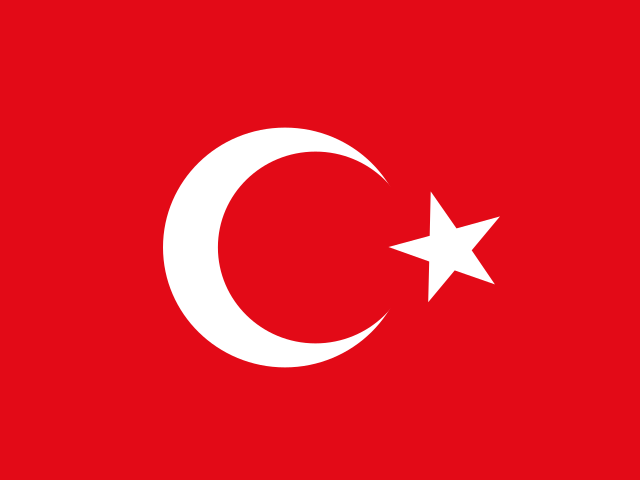 Türkiye TURWestern Asia | 2.649 | 2.771 | 2.522 |
 India INDSouthern Asia | 2.641 | 2.260 | 3.050 |
 Portugal PRTSouthern Europe | 2.530 | 0.827 | 4.869 |
 Algeria DZANorthern Africa | 2.464 | 1.953 | 3.439 |
 Ecuador ECUSouth America | 2.431 | 1.255 | 3.924 |
 Cyprus CYPWestern Asia | 2.340 | 0.872 | 5.245 |
 Argentina ARGSouth America | 1.656 | 0.796 | 3.468 |
 Italy ITASouthern Europe | 1.528 | 0.527 | 2.900 |
 Burkina Faso BFAWestern Africa | 0.309 | 0.536 | 0.154 |
 Marshall Islands MHLMicronesia | 0.000 | 0.000 | 0.000 |
 Monaco MCOWestern Europe | 0.000 | 0.000 | 0.000 |
02In 2022
At either end
The 5 countries at each end of the headline, then the highest and lowest on each other measure.
Lowest
- Marshall Islandsshared0.000
- Monacoshared0.000
- Burkina Faso0.309
- Italy1.528
- Argentina1.656
Neither end is better. The values describe a shape, not a score. The middle country reads 5.218. “Shared” marks a value another country also holds.
Each measure’s ends
Female
Highest
British Virgin Islands12.500Lowest2 share it
Middle country: 2.533
Male
Highest
Andorra28.261Lowest2 share it
Middle country: 9.247
032021 → 2022
Since 2021
- +9 / −12countries joined / left
- 82values changed, of 83 in both
- 55 · 27rose · fell
- 1unchanged
Rose most
- Andorra5.319 → 13.636+8.317
- Seychelles1.948 → 8.500+6.552
- Jordan0.000 → 4.050+4.050
- Saudi Arabia6.683 → 9.899+3.216
- British Virgin Islands6.627 → 9.612+2.985
+ Brazil+ Ecuador+ Egypt+ Croatia+ Marshall Islands+ Namibia+ Rwanda+ Syria+ Thailand − Bulgaria
 − Colombia
 − Cuba
 − Denmark
 − United Kingdom
 − Iran
 − Oman
 − Turks and Caicos Islands
 − Ukraine
 − United States
 − Uzbekistan
 − Samoa
Changes in value, not in places: a country’s place also moves when others do.
04Caveats
Read before you use
91 distinct values among 92
Values are stored exactly as published, to 16 decimals. 2 countries share 0.000. Countries sharing a value share a position too.
2 empty cells
An empty cell means the publisher gave no figure. It is never a zero.
05The files
Download and cite
- .csv
For a spreadsheet or code
92 rows · 7.3 KB · UTF-8, opens in Excel
Opens with 11 lines of source notes; the table starts on row 13.
Download ict-graduates-2022-nations-inquiry.csv - ↗
The publisher’s original
UIS’s own file, on its own site.
indicators
What this site changed: Reshaped to one row per country, with its ISO code; no value recalculated, rescaled or rounded. In full
Licence: CC BY-SA 4.0 · what it allows, in plain words
Cite this edition
UNESCO Institute for Statistics (UIS) (2022). Share of Graduates from ICT Programmes, 2022 [data set], describing 2022. As held by Nations Inquiry, https://nationsinquiry.com/datasets/ict-graduates/2022
0620 held
Other years
‹ The year before
Share of Graduates from ICT Programmes, 202195 countries
The year after ›
Share of Graduates from ICT Programmes, 2023102 countries
All of them
Share of Graduates from ICT Programmes: every year20 held, with the data dictionary, coverage and licence.
How it has moved, charted by country