Data for 2002
Participation in Organised Learning One Year Before Primary, 2002
Figures for 2002, as UIS published them · stored as published, never rewritten
This is the share of children already in organised learning — pre-primary or primary school — one year before the age at which their country starts primary school. It is SDG indicator 4.2.2, the world's yardstick for whether children get a start in learning before formal schooling begins.
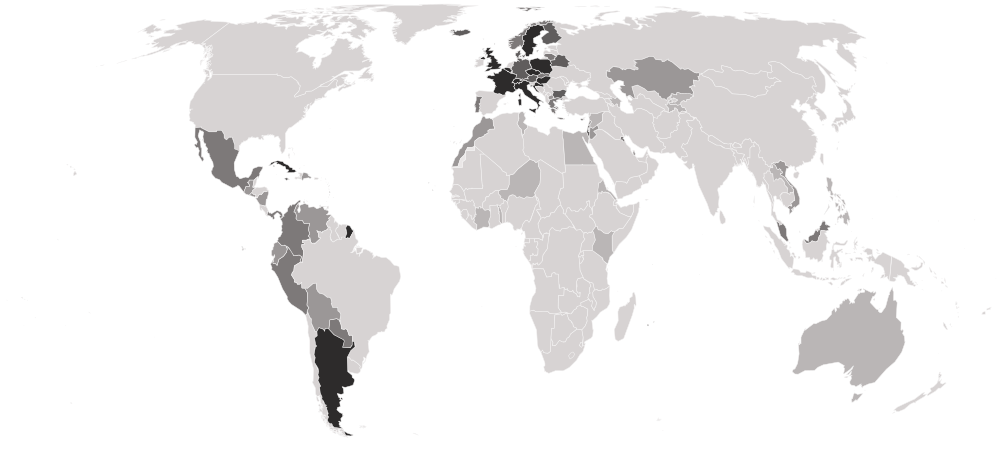
Participation in Organised Learning One Year Before Primary, 2002 covers 80 countries on 3 measures. United Kingdom is highest, at 99.873; Tajikistan is lowest, at 8.737. The middle country reads 79.973. Against 2001, 71 values changed (42 up, 29 down), 9 countries joined, 8 left.
Participation in Organised Learning One Year Before Primary · Data for 2002
HighestUnited Kingdom
99.873
LowestTajikistan
8.737Shaded by value in five groups of equal size, darkest at the better end.
01Position · derived
The table
Every country and every column of Participation in Organised Learning One Year Before Primary, 2002, as published. UIS ranks nobody on this measure; the position is derived here by ordering the published values. “=” marks a shared position.
Showing 25 of 80 countries · select a heading to sort
| derived | ||||
|---|---|---|---|---|
| 1 | United KingdomGBRNorthern Europe | 99.873 | 99.74 | 100.000 |
| 2 |  Belgium BELWestern Europe | 99.872 | 100.00 | 99.748 |
| 3 |  Switzerland CHEWestern Europe | 99.739 | 99.93 | 99.552 |
| 4 |  Hungary HUNEastern Europe | 99.670 | 99.51 | 99.827 |
| 5 |  Sweden SWENorthern Europe | 99.501 | 99.58 | 99.426 |
| 6 |  Italy ITASouthern Europe | 99.108 | 98.17 | 100.000 |
| 7 |  Czechia CZEEastern Europe | 99.077 | 99.01 | 99.143 |
| 8 |  Argentina ARGSouth America | 98.542 | 100.00 | 97.153 |
| 9 |  Poland POLEastern Europe | 97.710 | 97.26 | 98.136 |
| 10 |  Aruba ABWCaribbean | 97.410 | — | — |
| 11 |  Cuba CUBCaribbean | 97.224 | 97.21 | 97.235 |
| 12 |  Cayman Islands CYMCaribbean | 97.179 | — | — |
| 13 |  Barbados BRBCaribbean | 97.157 | 99.44 | 94.934 |
| 14 |  Croatia HRVSouthern Europe | 97.065 | 96.57 | 97.535 |
| 15 |  Hong Kong HKGEastern Asia | 97.051 | 97.51 | 96.620 |
| 16 |  France FRAWestern Europe | 96.911 | 97.29 | 96.554 |
| 17 |  Finland FINNorthern Europe | 96.747 | 96.63 | 96.861 |
| 18 |  Montserrat MSRCaribbean | 96.667 | — | — |
| 19 |  Luxembourg LUXWestern Europe | 96.620 | 97.78 | 95.552 |
| 20 |  Turks and Caicos Islands TCACaribbean | 95.913 | 91.85 | 100.000 |
| 21 |  Denmark DNKNorthern Europe | 95.787 | 95.79 | 95.787 |
| 22 |  Jamaica JAMCaribbean | 95.643 | 96.95 | 94.384 |
| 23 |  Seychelles SYCEastern Africa | 93.902 | 97.19 | 90.992 |
| 24 |  Iceland ISLNorthern Europe | 93.682 | 94.27 | 93.125 |
| 25 |  Anguilla AIACaribbean | 93.137 | 98.10 | 87.879 |
| 26 |  Austria AUTWestern Europe | 92.921 | 92.85 | 92.988 |
| 27 |  Grenada GRDCaribbean | 92.692 | 95.53 | 90.037 |
| 28 |  Macau MACEastern Asia | 90.141 | 90.06 | 90.210 |
| 29 |  Bulgaria BGREastern Europe | 89.921 | 89.45 | 90.372 |
| 30 |  Israel ISRWestern Asia | 89.647 | 88.96 | 90.299 |
| 31 |  Belarus BLREastern Europe | 88.484 | 87.26 | 89.648 |
| 32 |  Germany DEUWestern Europe | 87.976 | 88.74 | 87.255 |
| 33 |  Mexico MEXCentral America | 86.821 | 87.33 | 86.332 |
| 34 |  Portugal PRTSouthern Europe | 85.818 | — | — |
| 35 |  Norway NORNorthern Europe | 84.835 | 87.38 | 82.429 |
| 36 |  Mauritius MUSEastern Africa | 82.071 | 81.34 | 82.799 |
| 37 |  Peru PERSouth America | 81.944 | 82.27 | 81.625 |
| 38 |  Slovakia SVKEastern Europe | 81.930 | 81.08 | 82.733 |
| 39 |  Greece GRCSouthern Europe | 80.248 | 80.43 | 80.077 |
| 40 |  Lithuania LTUNorthern Europe | 80.069 | 79.92 | 80.207 |
| 41 |  Colombia COLSouth America | 79.877 | — | — |
| 42 |  Saint Lucia LCACaribbean | 78.054 | 78.01 | 78.095 |
| 43 |  Kuwait KWTWestern Asia | 77.996 | 80.90 | 75.261 |
| 44 |  Cyprus CYPWestern Asia | 77.746 | 76.83 | 78.620 |
| 45 |  Panama PANCentral America | 77.315 | 77.88 | 76.774 |
| 46 |  Paraguay PRYSouth America | 76.427 | 77.68 | 75.230 |
| 47 |  Malaysia MYSSouth-eastern Asia | 75.861 | 79.27 | 72.717 |
| 48 |  Cabo Verde CPVWestern Africa | 75.804 | 77.15 | 74.508 |
| 49 |  North Macedonia MKDSouthern Europe | 75.779 | 77.96 | 73.809 |
| 50 |  Lebanon LBNWestern Asia | 75.518 | 75.23 | 75.799 |
| 51 |  El Salvador SLVCentral America | 75.076 | 77.21 | 73.026 |
| 52 |  Venezuela VENSouth America | 74.983 | 76.08 | 73.941 |
| 53 |  Kazakhstan KAZCentral Asia | 74.982 | 73.89 | 76.081 |
| 54 |  Vietnam VNMSouth-eastern Asia | 73.719 | — | — |
| 55 |  Nicaragua NICCentral America | 72.555 | 73.38 | 71.744 |
| 56 |  Ecuador ECUSouth America | 72.084 | 73.30 | 70.910 |
| 57 |  Maldives MDVSouthern Asia | 70.400 | 73.44 | 67.690 |
| 58 |  Jordan JORWestern Asia | 69.350 | 67.72 | 70.906 |
| 59 |  Bolivia BOLSouth America | 67.541 | 68.40 | 66.714 |
| 60 |  Guatemala GTMCentral America | 65.585 | 64.90 | 66.254 |
| 61 |  Qatar QATWestern Asia | 64.630 | 65.37 | 63.930 |
| 62 |  Dominican Republic DOMCaribbean | 61.604 | 61.11 | 62.076 |
| 63 |  Bahrain BHRWestern Asia | 60.137 | 58.66 | 61.564 |
| 64 |  Morocco MARNorthern Africa | 55.875 | 41.81 | 69.128 |
| 65 |  Marshall Islands MHLMicronesia | 55.468 | 56.50 | 54.508 |
| 66 |  Australia AUSAustralia and New Zealand | 52.262 | 52.55 | 51.991 |
| 67 |  Palestine PSEWestern Asia | 52.043 | 50.30 | 53.720 |
| 68 |  Syria SYRWestern Asia | 48.951 | 47.02 | 50.790 |
| 69 |  Kenya KENEastern Africa | 45.495 | 45.54 | 45.452 |
| 70 |  Tunisia TUNNorthern Africa | 41.127 | 41.16 | 41.098 |
| 71 |  Kyrgyzstan KGZCentral Asia | 41.085 | 40.11 | 42.107 |
| 72 |  Côte d’Ivoire CIVWestern Africa | 40.463 | 37.08 | 43.650 |
| 73 |  Togo TGOWestern Africa | 36.213 | 34.77 | 37.647 |
| 74 |  Philippines PHLSouth-eastern Asia | 24.896 | 24.95 | 24.846 |
| 75 |  Azerbaijan AZEWestern Asia | 23.244 | 23.56 | 22.946 |
| 76 |  Eritrea ERIEastern Africa | 21.292 | 20.30 | 22.273 |
| 77 |  Egypt EGYNorthern Africa | 13.680 | 13.38 | 13.961 |
| 78 |  Niger NERWestern Africa | 12.550 | 11.56 | 13.508 |
| 79 |  Laos LAOSouth-eastern Asia | 8.940 | 9.23 | 8.654 |
| 80 | TajikistanTJKCentral Asia | 8.737 | — | — |
02In 2002
At either end
The 5 countries at each end of the headline, then the highest and lowest on each other measure.
Highest
- 1United Kingdom99.873
- 2Belgium99.872
- 3Switzerland99.739
- 4Hungary99.670
- 5Sweden99.501
Lowest
- 80Tajikistan8.737
- 79Laos8.940
- 78Niger12.550
- 77Egypt13.680
- 76Eritrea21.292
A higher value is the better result. The middle country reads 79.973. “Shared” marks a value another country also holds.
Each measure’s ends
032001 → 2002
Since 2001
- +9 / −8countries joined / left
- 71values changed, of 71 in both
- 42 · 29rose · fell
- 0unchanged
Rose most
- Cayman Islands86.921 → 97.179+10.259
- Bulgaria80.979 → 89.921+8.942
- Cabo Verde67.488 → 75.804+8.316
- Barbados89.647 → 97.157+7.510
- Tunisia34.121 → 41.127+7.007
Fell most
- Israel99.189 → 89.647−9.542
- Greece88.441 → 80.248−8.192
- North Macedonia82.700 → 75.779−6.920
- Cyprus82.042 → 77.746−4.296
- Palestine55.924 → 52.043−3.881
+ Dominican Republic+ Grenada+ Hong Kong+ Hungary+ Jordan+ Morocco+ Marshall Islands+ Montserrat+ Malaysia − Albania
 − Burkina Faso
 − Belize
 − Madagascar
 − Romania
 − Trinidad and Tobago
 − British Virgin Islands
 − Samoa
Changes in value, not in places: a country’s place also moves when others do.
04Caveats
Read before you use
14 empty cells
An empty cell means the publisher gave no figure. It is never a zero.
05The files
Download and cite
- .csv
For a spreadsheet or code
80 rows · 6.5 KB · UTF-8, opens in Excel
Opens with 11 lines of source notes; the table starts on row 13.
Download early-learning-participation-2002-nations-inquiry.csv - ↗
The publisher’s original
UIS’s own file, on its own site.
indicators
What this site changed: Reshaped to one row per country, with its ISO code; no value recalculated, rescaled or rounded. In full
Licence: CC BY-SA 4.0 · what it allows, in plain words
Cite this edition
UNESCO Institute for Statistics (UIS) (2002). Participation in Organised Learning One Year Before Primary, 2002 [data set], describing 2002. As held by Nations Inquiry, https://nationsinquiry.com/datasets/early-learning-participation/2002
0626 held
Other years
‹ The year before
Participation in Organised Learning One Year Before Primary, 200179 countries
The year after ›
Participation in Organised Learning One Year Before Primary, 200382 countries
All of them
Participation in Organised Learning One Year Before Primary: every year26 held, with the data dictionary, coverage and licence.
How it has moved, charted by country