Data for 2001
Participation in Organised Learning One Year Before Primary, 2001
Figures for 2001, as UIS published them · stored as published, never rewritten
This is the share of children already in organised learning — pre-primary or primary school — one year before the age at which their country starts primary school. It is SDG indicator 4.2.2, the world's yardstick for whether children get a start in learning before formal schooling begins.
Participation in Organised Learning One Year Before Primary, 2001 covers 79 countries on 3 measures. Belgium is highest, at 99.91; Niger is lowest, at 8.59. The middle country reads 80.76. Against 2000, 47 values changed (33 up, 14 down), 32 countries joined, 15 left.
Participation in Organised Learning One Year Before Primary · Data for 2001
HighestBelgium
99.91
LowestNiger
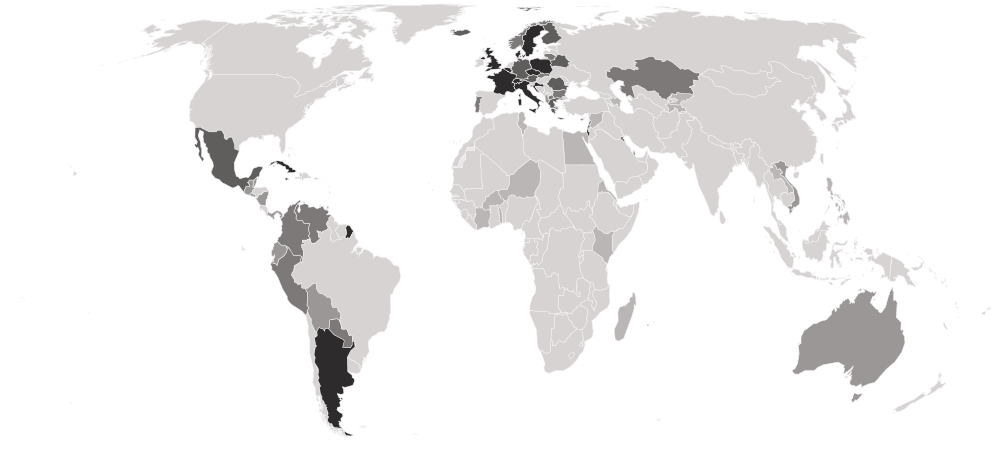
8.59Shaded by value in five groups of equal size, darkest at the better end.
01Position · derived
The table
Every country and every column of Participation in Organised Learning One Year Before Primary, 2001, as published. UIS ranks nobody on this measure; the position is derived here by ordering the published values. “=” marks a shared position.
Showing 25 of 79 countries · select a heading to sort
| derived | ||||
|---|---|---|---|---|
| 1 | BelgiumBELWestern Europe | 99.91 | 99.82 | 100.00 |
| 2 |  Sweden SWENorthern Europe | 99.87 | 99.73 | 100.00 |
| 3 |  Cuba CUBCaribbean | 99.86 | 99.71 | 100.00 |
| 4 |  Switzerland CHEWestern Europe | 99.52 | 100.00 | 99.07 |
| 5 |  Israel ISRWestern Asia | 99.19 | 98.34 | 100.00 |
| 6 |  Italy ITASouthern Europe | 99.03 | 98.07 | 99.94 |
| 7 |  United Kingdom GBRNorthern Europe | 98.98 | 98.64 | 99.31 |
| 8 |  Argentina ARGSouth America | 98.47 | 100.00 | 97.01 |
| 9 |  British Virgin Islands VGBCaribbean | 98.10 | 100.00 | 96.24 |
| 10 |  Poland POLEastern Europe | 98.09 | 97.66 | 98.50 |
| 11 |  Denmark DNKNorthern Europe | 97.92 | 97.88 | 97.95 |
| 12 |  Croatia HRVSouthern Europe | 97.46 | 97.15 | 97.76 |
| 13 |  Czechia CZEEastern Europe | 97.29 | 97.20 | 97.38 |
| 14 |  France FRAWestern Europe | 97.25 | 97.25 | 97.24 |
| 15 |  Luxembourg LUXWestern Europe | 96.31 | 97.56 | 95.12 |
| 16 |  Aruba ABWCaribbean | 95.61 | 100.00 | 91.78 |
| 17 |  Iceland ISLNorthern Europe | 94.78 | 93.63 | 95.86 |
| 18 |  Seychelles SYCEastern Africa | 93.47 | 93.93 | 93.03 |
| 19 |  Austria AUTWestern Europe | 92.81 | 92.80 | 92.82 |
| 20 |  Jamaica JAMCaribbean | 92.79 | 93.67 | 91.94 |
| 21 |  Anguilla AIACaribbean | 92.54 | 93.94 | 91.18 |
| 22 |  Macau MACEastern Asia | 90.98 | 91.13 | 90.83 |
| 23 |  Finland FINNorthern Europe | 90.89 | 91.12 | 90.66 |
| 24 |  Romania ROUEastern Europe | 90.22 | 91.16 | 89.33 |
| 25 |  Barbados BRBCaribbean | 89.65 | 91.78 | 87.54 |
| 26 |  Germany DEUWestern Europe | 89.54 | 90.48 | 88.64 |
| 27 |  Turks and Caicos Islands TCACaribbean | 89.06 | — | — |
| 28 |  Belarus BLREastern Europe | 88.69 | — | — |
| 29 |  Greece GRCSouthern Europe | 88.44 | 88.38 | 88.49 |
| 30 |  Mexico MEXCentral America | 87.86 | 88.40 | 87.34 |
| 31 |  Cayman Islands CYMCaribbean | 86.92 | — | — |
| 32 |  Portugal PRTSouthern Europe | 84.96 | 87.28 | 82.81 |
| 33 |  Slovakia SVKEastern Europe | 84.25 | 83.47 | 85.00 |
| 34 |  North Macedonia MKDSouthern Europe | 82.70 | 83.08 | 82.34 |
| 35 |  Norway NORNorthern Europe | 82.52 | 84.94 | 80.23 |
| 36 |  Mauritius MUSEastern Africa | 82.34 | 83.00 | 81.70 |
| 37 |  Cyprus CYPWestern Asia | 82.04 | 82.01 | 82.07 |
| 38 |  Kuwait KWTWestern Asia | 81.48 | 83.23 | 79.83 |
| 39 |  Bulgaria BGREastern Europe | 80.98 | 80.91 | 81.05 |
| 40 |  Peru PERSouth America | 80.76 | 81.16 | 80.38 |
| 41 |  Colombia COLSouth America | 79.01 | — | — |
| 42 |  Paraguay PRYSouth America | 76.90 | 78.85 | 75.04 |
| 43 |  Venezuela VENSouth America | 76.72 | 77.79 | 75.70 |
| 44 |  Lebanon LBNWestern Asia | 76.44 | 76.04 | 76.83 |
| 45 |  Saint Lucia LCACaribbean | 74.90 | 77.87 | 72.05 |
| 46 |  Lithuania LTUNorthern Europe | 74.61 | 75.86 | 73.41 |
| 47 |  Kazakhstan KAZCentral Asia | 74.32 | 73.12 | 75.53 |
| 48 |  Panama PANCentral America | 74.09 | 74.86 | 73.35 |
| 49 |  Nicaragua NICCentral America | 72.24 | 73.32 | 71.19 |
| 50 |  Vietnam VNMSouth-eastern Asia | 71.68 | — | — |
| 51 |  El Salvador SLVCentral America | 71.61 | 72.95 | 70.31 |
| 52 |  Ecuador ECUSouth America | 69.94 | 71.07 | 68.86 |
| 53 |  Maldives MDVSouthern Asia | 69.46 | 72.37 | 66.85 |
| 54 |  Cabo Verde CPVWestern Africa | 67.49 | 70.90 | 64.21 |
| 55 |  Bolivia BOLSouth America | 67.06 | 67.65 | 66.49 |
| 56 |  Guatemala GTMCentral America | 64.20 | 63.71 | 64.68 |
| 57 |  Belize BLZCentral America | 61.69 | 63.31 | 60.15 |
| 58 |  Trinidad and Tobago TTOCaribbean | 59.77 | 57.98 | 61.49 |
| 59 |  Qatar QATWestern Asia | 57.91 | 58.32 | 57.53 |
| 60 |  Albania ALBSouthern Europe | 57.52 | 59.32 | 55.72 |
| 61 |  Bahrain BHRWestern Asia | 56.85 | 55.16 | 58.50 |
| 62 |  Palestine PSEWestern Asia | 55.92 | 53.34 | 58.41 |
| 63 |  Australia AUSAustralia and New Zealand | 53.59 | 53.64 | 53.54 |
| 64 |  Syria SYRWestern Asia | 48.04 | 46.12 | 49.87 |
| 65 |  Kenya KENEastern Africa | 47.41 | 47.66 | 47.16 |
| 66 |  Kyrgyzstan KGZCentral Asia | 41.13 | 39.66 | 42.68 |
| 67 |  Côte d’Ivoire CIVWestern Africa | 40.33 | 37.52 | 42.98 |
| 68 |  Samoa WSMPolynesia | 34.80 | 38.41 | 31.46 |
| 69 |  Togo TGOWestern Africa | 34.53 | 33.06 | 35.98 |
| 70 |  Tunisia TUNNorthern Africa | 34.12 | 34.18 | 34.07 |
| 71 |  Philippines PHLSouth-eastern Asia | 22.73 | 22.84 | 22.62 |
| 72 |  Azerbaijan AZEWestern Asia | 21.91 | 21.27 | 22.55 |
| 73 |  Burkina Faso BFAWestern Africa | 21.11 | 18.64 | 23.53 |
| 74 |  Eritrea ERIEastern Africa | 18.60 | 17.74 | 19.46 |
| 75 |  Egypt EGYNorthern Africa | 13.71 | 13.26 | 14.13 |
| 76 |  Tajikistan TJKCentral Asia | 12.05 | — | — |
| 77 |  Madagascar MDGEastern Africa | 10.48 | 10.93 | 10.04 |
| 78 |  Laos LAOSouth-eastern Asia | 9.22 | 9.54 | 8.92 |
| 79 | NigerNERWestern Africa | 8.59 | 8.05 | 9.11 |
02In 2001
At either end
The 5 countries at each end of the headline, then the highest and lowest on each other measure.
Highest
- 1Belgium99.91
- 2Sweden99.87
- 3Cuba99.86
- 4Switzerland99.52
- 5Israel99.19
Lowest
- 79Niger8.59
- 78Laos9.22
- 77Madagascar10.48
- 76Tajikistan12.05
- 75Egypt13.71
A higher value is the better result. The middle country reads 80.76. “Shared” marks a value another country also holds.
Each measure’s ends
032000 → 2001
Since 2000
- +32 / −15countries joined / left
- 47values changed, of 47 in both
- 33 · 14rose · fell
- 0unchanged
Rose most
- British Virgin Islands72.63 → 98.10+25.47
- Belize54.74 → 61.69+6.95
- Panama67.38 → 74.09+6.70
- Azerbaijan15.81 → 21.91+6.09
- El Salvador65.72 → 71.61+5.88
Fell most
- Seychelles98.26 → 93.47−4.79
- Vietnam75.48 → 71.68−3.79
- North Macedonia85.81 → 82.70−3.11
- Samoa37.08 → 34.80−2.28
- Aruba97.09 → 95.61−1.48
+ Anguilla+ Australia+ Austria+ Belgium+ Burkina Faso+ Bulgaria+ Belarus+ Cabo Verde+ Cayman Islands+ Cyprus+ Czechia+ Germany+ Denmark+ Finland+ France+ Croatia+ Israel+ Italy+ Jamaica+ Kazakhstan+ Kenya+ Lithuania+ Luxembourg+ Macau+ Norway+ Philippines+ Poland+ Portugal+ Qatar+ Romania+ Slovakia+ Sweden − Bhutan
 − Dominican Republic
 − Guinea-Bissau
 − Equatorial Guinea
 − Honduras
 − Iraq
 − Jordan
 − Cambodia
 − Liberia
 − Morocco
 − Montserrat
 − Malaysia
 − Senegal
 − San Marino
 − South Africa
Changes in value, not in places: a country’s place also moves when others do.
04Caveats
Read before you use
12 empty cells
An empty cell means the publisher gave no figure. It is never a zero.
05The files
Download and cite
- .csv
For a spreadsheet or code
79 rows · 6.4 KB · UTF-8, opens in Excel
Opens with 11 lines of source notes; the table starts on row 13.
Download early-learning-participation-2001-nations-inquiry.csv - ↗
The publisher’s original
UIS’s own file, on its own site.
indicators
What this site changed: Reshaped to one row per country, with its ISO code; no value recalculated, rescaled or rounded. In full
Licence: CC BY-SA 4.0 · what it allows, in plain words
Cite this edition
UNESCO Institute for Statistics (UIS) (2001). Participation in Organised Learning One Year Before Primary, 2001 [data set], describing 2001. As held by Nations Inquiry, https://nationsinquiry.com/datasets/early-learning-participation/2001
0626 held
Other years
‹ The year before
Participation in Organised Learning One Year Before Primary, 200062 countries
The year after ›
Participation in Organised Learning One Year Before Primary, 200280 countries
All of them
Participation in Organised Learning One Year Before Primary: every year26 held, with the data dictionary, coverage and licence.
How it has moved, charted by country