Data for 2024
Low Pay Rate, 2024
2024, as ILO’s 2026 release gives it · stored as published, never rewritten
This is the share of employees whose hourly pay is below two-thirds of the typical — median — hourly pay in their own country. It is a standard international measure of low pay, and shows how many workers sit far below the middle of the wage scale.
Low Pay Rate, 2024 covers 71 countries. Tanzania is highest, at 41.69; New Zealand is lowest, at 3.40. The middle country reads 17.89. Against 2023, 63 values changed (22 up, 41 down), 7 countries joined, 13 left.
Low Pay Rate · Data for 2024
HighestTanzania
41.69
LowestNew Zealand
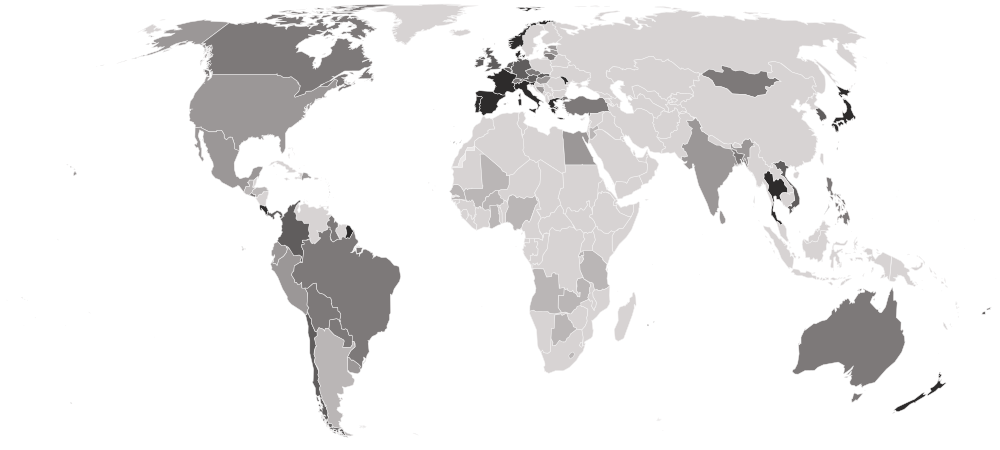
3.40Shaded by value in five groups of equal size, darkest at the lowest end.
01Position · derived
The table
Every country and every column of Low Pay Rate, 2024, as published. ILO ranks nobody on this measure; the position is derived here by ordering the published values. “=” marks a shared position.
Showing 25 of 71 countries · select a heading to sort
| derived | |||||
|---|---|---|---|---|---|
| 1 | TanzaniaTZAEastern Africa | 41.69 | Labour Force Survey | — | Break in series |
| 2 |  Jordan JORWestern Asia | 40.84 | Employment and Unemployment Survey | — | — |
| 3 |  Burkina Faso BFAWestern Africa | 40.17 | Labour Force Survey | — | — |
| 4 |  Lesotho LSOSouthern Africa | 39.47 | Integrated Labour Force Survey | — | — |
| 5 |  Ghana GHAWestern Africa | 38.73 | Household Income and Expenditure Survey | — | — |
| 6 |  Botswana BWASouthern Africa | 35.46 | Multi-Topic Household Survey | — | — |
| 7 |  Zambia ZMBEastern Africa | 35.27 | Labour Force Survey | — | — |
| 8 |  Guatemala GTMCentral America | 34.06 | Employment and Income Survey | — | Break in series |
| 9 |  Mali MLIWestern Africa | 33.76 | Continuous Household Employment Survey | — | — |
| 10 |  Angola AGOMiddle Africa | 33.26 | Employment Survey | — | — |
| 11 |  Rwanda RWAEastern Africa | 32.09 | Labour Force Survey | — | — |
| 12 |  Senegal SENWestern Africa | 31.89 | National Employment Survey | — | — |
| 13 |  Nigeria NGAWestern Africa | 29.41 | General Household Survey | — | — |
| 14 |  Argentina ARGSouth America | 27.60 | Permanent Household Survey, Urban | Geographical coverage: Main cities or metropolitan areas | — |
| 15 |  Honduras HNDCentral America | 27.12 | Continuous Multi-Purpose Household Survey | — | — |
| 16 |  India INDSouthern Asia | 26.16 | Periodic Labour Force Survey | — | — |
| 17 |  Palestine PSEWestern Asia | 25.03 | Labour Force Survey | Geographical coverage: Excluding Gaza Strip | Break in series |
| 18 |  Latvia LVANorthern Europe | 24.86 | Structure of Earnings Survey | — | — |
| 19 |  Peru PERSouth America | 24.85 | Permanent Employment Survey, National | — | — |
| 20 |  Bosnia and Herzegovina BIHSouthern Europe | 23.77 | Labour Force Survey | — | — |
| 21 |  Estonia ESTNorthern Europe | 22.36 | Structure of Earnings Survey | — | — |
| 22 |  United States USANorthern America | 22.34 | Current Population Survey | — | — |
| 23 |  Hungary HUNEastern Europe | 22.06 | Survey of Individual Wages and Earnings | — | — |
| 24 |  Sri Lanka LKASouthern Asia | 22.00 | Labour Force Survey | — | — |
| 25 |  Uruguay URYSouth America | 21.78 | Continuous Household Survey Implantation | — | — |
| 26 |  Mexico MEXCentral America | 21.66 | National Occupation and Employment Survey | — | — |
| 27 |  Dominican Republic DOMCaribbean | 20.92 | Continuous National Labour Force Survey | — | — |
| 28 |  Egypt EGYNorthern Africa | 20.39 | Labour Force Sample Survey | — | Break in series |
| 29 |  Ecuador ECUSouth America | 19.91 | National Survey on Employment, Unemployment and Underemployment | — | — |
| 30 |  Bangladesh BGDSouthern Asia | 19.87 | Labour Force Survey | — | — |
| 31 |  Lithuania LTUNorthern Europe | 19.59 | Structure of Earnings Survey | — | — |
| 32 |  Switzerland CHEWestern Europe | 19.27 | Labour Force Survey | — | — |
| 33 |  Bolivia BOLSouth America | 19.10 | Continuous Employment Survey | — | — |
| 34 |  Australia AUSAustralia and New Zealand | 19.03 | Labour Force Survey | — | — |
| 35 |  Canada CANNorthern America | 18.51 | Labour Force Survey | — | — |
| 36 |  Brazil BRASouth America | 17.89 | Continuous National Household Sample Survey | — | — |
| 37 |  Guyana GUYSouth America | 17.63 | Labour Force Survey | — | — |
| 38 |  Paraguay PRYSouth America | 17.59 | Continuous Permanent Household Survey | — | — |
| =39 |  Czechia CZEEastern Europe | 17.34 | Periodic Census of Employers | — | — |
| =39 |  Mongolia MNGEastern Asia | 17.34 | Labour Force Survey | — | — |
| 41 |  Philippines PHLSouth-eastern Asia | 17.30 | Labour Force Survey | — | — |
| 42 |  Türkiye TURWestern Asia | 17.18 | Household Labour Force Survey | — | — |
| 43 |  El Salvador SLVCentral America | 16.94 | Multi-purpose Household Survey | — | — |
| 44 |  Mauritius MUSEastern Africa | 16.76 | Continuous Multi-Purpose Household Survey | — | — |
| 45 |  United Kingdom GBRNorthern Europe | 16.60 | Labour Force Survey | — | — |
| 46 |  Panama PANCentral America | 16.41 | Labour Market Survey | — | — |
| 47 |  South Korea KOREastern Asia | 16.08 | Survey on labor conditions by employment type | — | — |
| 48 |  Slovakia SVKEastern Europe | 16.00 | Monthly Structure of Earnings Survey | — | — |
| 49 |  Germany DEUWestern Europe | 15.15 | German Socio-Economic Panel | — | — |
| 50 |  Austria AUTWestern Europe | 14.43 | Wage Tax Statistics | — | — |
| 51 |  Ireland IRLNorthern Europe | 13.10 | Other Official Sources | — | — |
| 52 |  Netherlands NLDWestern Europe | 12.96 | Structure of Earnings Survey | — | — |
| 53 |  Colombia COLSouth America | 12.55 | Integrated Household Survey | — | — |
| 54 |  Fiji FJIMelanesia | 12.49 | Employment, Unemployment Survey | — | — |
| 55 |  Chile CHLSouth America | 12.34 | National Survey on Socio-Economic Conditions | — | — |
| 56 |  Belgium BELWestern Europe | 11.61 | Structure of Earnings Survey | — | — |
| 57 |  Vietnam VNMSouth-eastern Asia | 11.50 | Labour Force Survey | — | — |
| 58 |  Luxembourg LUXWestern Europe | 11.42 | Structure of Earnings Survey | — | — |
| 59 |  Thailand THASouth-eastern Asia | 11.25 | Labour Force Survey | — | — |
| 60 |  Slovenia SVNSouthern Europe | 11.09 | Structure of Earnings Survey | — | — |
| 61 |  Moldova MDAEastern Europe | 10.95 | Labour Force Survey | — | — |
| 62 |  France FRAWestern Europe | 10.52 | Employment Survey | — | — |
| 63 |  Japan JPNEastern Asia | 10.47 | Wage Structure Survey | — | — |
| 64 |  Costa Rica CRICentral America | 10.41 | Continuous Employment Survey | — | — |
| 65 |  Greece GRCSouthern Europe | 9.74 | EU Statistics on Income and Living Conditions | — | — |
| 66 |  Denmark DNKNorthern Europe | 9.72 | Insurance Records | — | — |
| 67 |  Spain ESPSouthern Europe | 9.51 | EU Statistics on Income and Living Conditions | — | — |
| 68 |  Norway NORNorthern Europe | 6.73 | Labour-related Establishment Survey | — | — |
| 69 |  Italy ITASouthern Europe | 5.63 | Household Income and Wealth Survey | — | — |
| 70 |  Portugal PRTSouthern Europe | 3.79 | Employment Survey | — | — |
| 71 | New ZealandNZLAustralia and New Zealand | 3.40 | Household Economic Survey | — | — |
02In 2024
At either end
The 5 countries at each end of the headline.
Highest
- 1Tanzania41.69
- 2Jordan40.84
- 3Burkina Faso40.17
- 4Lesotho39.47
- 5Ghana38.73
Lowest
- 71New Zealand3.40
- 70Portugal3.79
- 69Italy5.63
- 68Norway6.73
- 67Spain9.51
A higher value is the worse result. The middle country reads 17.89. “Shared” marks a value another country also holds.
032023 → 2024
Since 2023
- +7 / −13countries joined / left
- 63values changed, of 64 in both
- 22 · 41rose · fell
- 1unchanged
Rose most
- Bosnia and Herzegovina11.06 → 23.77+12.71
- Guatemala21.81 → 34.06+12.26
- Zambia27.26 → 35.27+8.00
- Chile8.39 → 12.34+3.95
- Brazil14.17 → 17.89+3.72
+ Burkina Faso+ Fiji+ Guyana+ Lesotho+ Nigeria+ Palestine+ Tanzania − Antigua and Barbuda
 − Bahamas
 − Cook Islands
 − Finland
 − Equatorial Guinea
 − Indonesia
 − Israel
 − Cambodia
 − Kiribati
 − Poland
 − Eswatini
 − Tonga
 − Zimbabwe
04Caveats
Read before you use
One year of the 2026 release
Every year in this series comes from ILO’s 2026 release, recalculated on one method, so a change from one year to the next is not a revision. It can differ from what was first published for 2024.
70 distinct values among 71
Values are stored exactly as published, to 3 decimals. 2 countries share 17.34. Countries sharing a value share a position too.
136 empty cells
An empty cell means the publisher gave no figure. It is never a zero.
Some readings carry a flag
ILO marks readings it considers estimates or provisional. The flags in this file: Break in series.
05The files
Download and cite
- .csv
For a spreadsheet or code
71 rows · 5.0 KB · UTF-8, opens in Excel
Opens with 11 lines of source notes; the table starts on row 13.
Download low-pay-rate-2024-nations-inquiry.csv - ↗
The publisher’s original
ILO’s own file, on its own site.
https://rplumber.ilo.org/data/indicator/?id=EAR_XTLP_SEX_RT&format=.csv&channel=ilostat
What this site changed: Reshaped to one row per country, with its ISO code; no value recalculated, rescaled or rounded. In full
Licence: CC BY 4.0 · what it allows, in plain words
Cite this edition
International Labour Organization (ILO) (2024). Low Pay Rate, 2024 [data set], describing 2024. As held by Nations Inquiry, https://nationsinquiry.com/datasets/low-pay-rate/2024
0618 held
Other years
‹ The year before
Low Pay Rate, 202377 countries
The year after ›
This is the newest year; the next will get a page of its own.
All of them
Low Pay Rate: every year18 held, with the data dictionary, coverage and licence.
How it has moved, charted by country