Data for 2016
Female Share of STEM Graduates, 2016
Figures for 2016, as UIS published them · stored as published, never rewritten
This is the share of tertiary graduates in science, technology, engineering and mathematics who are women. Its point of balance is 50%, where women and men graduate from these programmes in equal numbers; above 50% means women outnumber men.
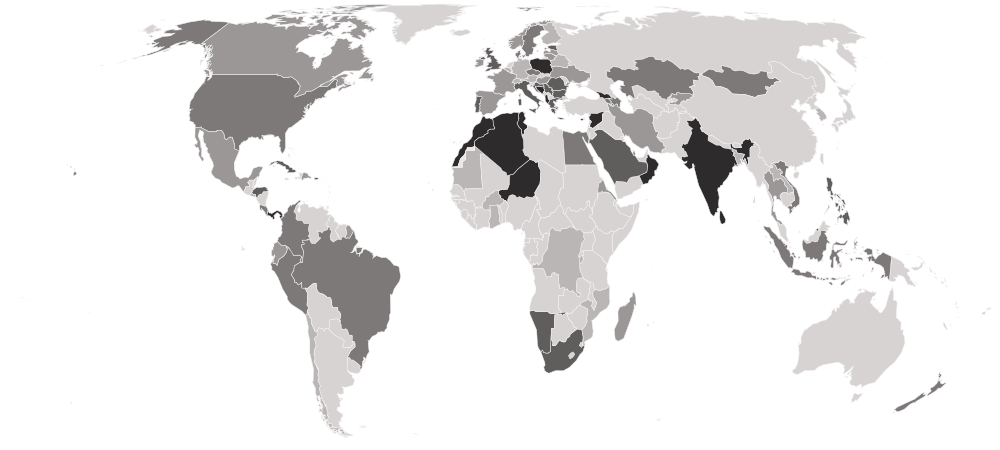
Female Share of STEM Graduates, 2016 covers 92 countries. Algeria is highest, at 55.472; Burkina Faso is lowest, at 16.041. The middle country reads 34.945. Against 2015, 76 values changed (50 up, 26 down), 16 countries joined, 18 left.
Female Share of STEM Graduates · Data for 2016
HighestAlgeria
55.472
LowestBurkina Faso
16.041Shaded by value in five groups of equal size, darkest at the highest end.
01Values only
The table
Every country and every column of Female Share of STEM Graduates, 2016, as published. The file carries values only, so no position is shown. “=” marks a shared position.
Showing 25 of 92 countries · select a heading to sort
AlgeriaDZANorthern Africa | 55.472 |
 Tunisia TUNNorthern Africa | 54.440 |
 Oman OMNWestern Asia | 52.837 |
 Brunei BRNSouth-eastern Asia | 51.855 |
 Syria SYRWestern Asia | 49.506 |
 Albania ALBSouthern Europe | 48.296 |
 Palestine PSEWestern Asia | 46.643 |
 Niger NERWestern Africa | 46.224 |
 Seychelles SYCEastern Africa | 46.000 |
 Bahrain BHRWestern Asia | 45.743 |
 Morocco MARNorthern Africa | 45.246 |
 Georgia GEOWestern Asia | 44.431 |
 Poland POLEastern Europe | 44.092 |
 Bosnia and Herzegovina BIHSouthern Europe | 43.866 |
 Sri Lanka LKASouthern Asia | 43.713 |
 Panama PANCentral America | 43.223 |
 India INDSouthern Asia | 42.717 |
 Cyprus CYPWestern Asia | 42.227 |
 Namibia NAMSouthern Africa | 41.933 |
 South Africa ZAFSouthern Africa | 41.862 |
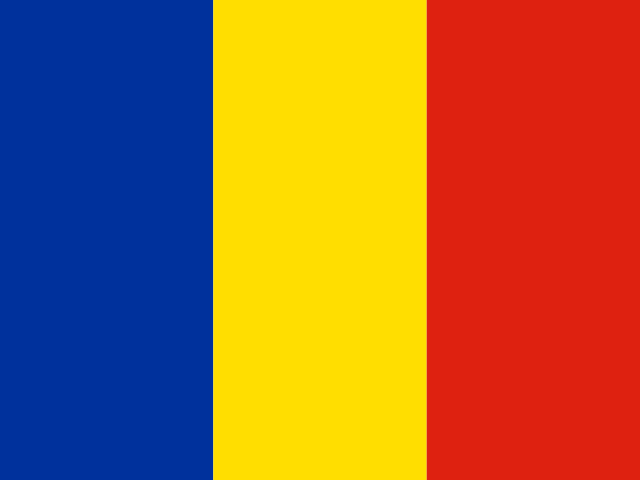 Romania ROUEastern Europe | 41.216 |
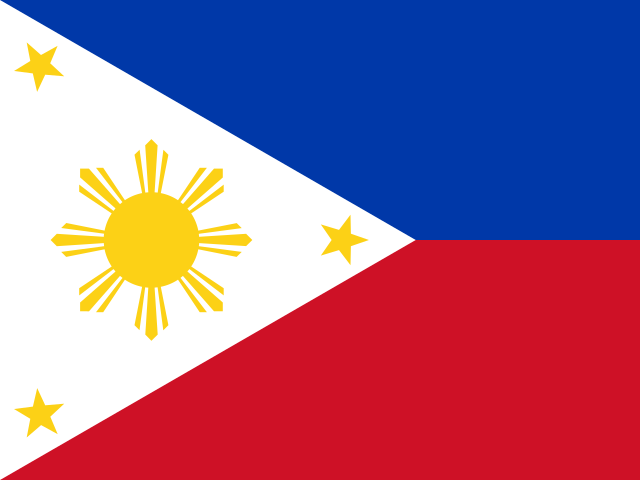 Philippines PHLSouth-eastern Asia | 41.205 |
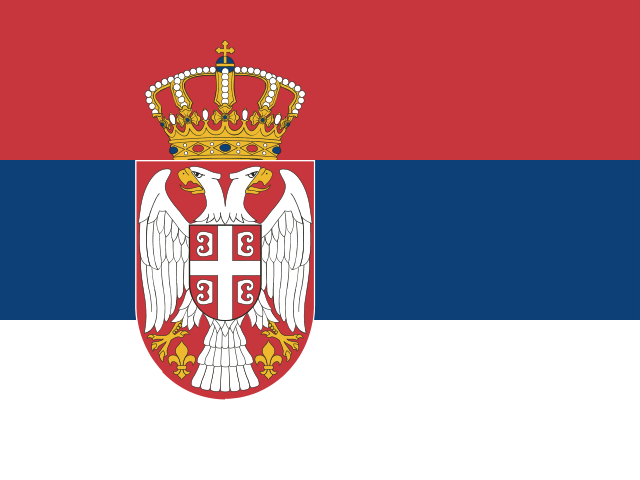 Serbia SRBSouthern Europe | 41.100 |
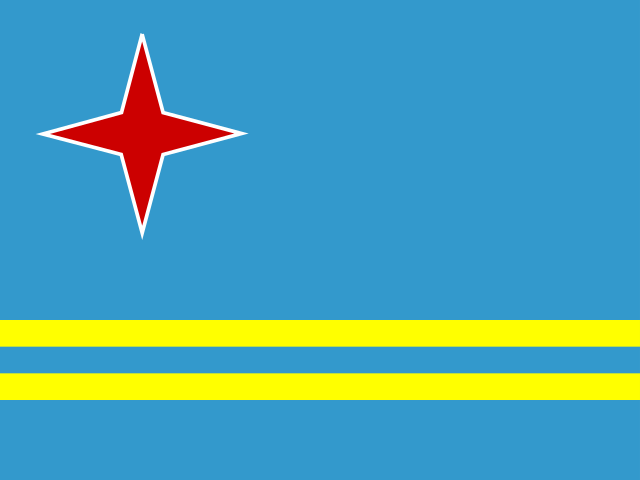 Aruba ABWCaribbean | 40.000 |
 Cuba CUBCaribbean | 39.889 |
 Greece GRCSouthern Europe | 39.821 |
 Italy ITASouthern Europe | 39.523 |
 Portugal PRTSouthern Europe | 39.105 |
 Saudi Arabia SAUWestern Asia | 39.028 |
 Cabo Verde CPVWestern Africa | 38.608 |
 Puerto Rico PRICaribbean | 38.501 |
 Estonia ESTNorthern Europe | 38.325 |
 Bulgaria BGREastern Europe | 38.260 |
 United Kingdom GBRNorthern Europe | 38.103 |
 Croatia HRVSouthern Europe | 37.923 |
 Honduras HNDCentral America | 37.798 |
 Egypt EGYNorthern Africa | 36.899 |
 Armenia ARMWestern Asia | 36.844 |
 Vietnam VNMSouth-eastern Asia | 36.509 |
 Indonesia IDNSouth-eastern Asia | 36.244 |
 Mongolia MNGEastern Asia | 36.092 |
 Czechia CZEEastern Europe | 35.379 |
 Brazil BRASouth America | 35.200 |
 Sweden SWENorthern Europe | 35.166 |
 New Zealand NZLAustralia and New Zealand | 35.097 |
 Kazakhstan KAZCentral Asia | 35.055 |
 Azerbaijan AZEWestern Asia | 34.835 |
 United States USANorthern America | 33.985 |
 Colombia COLSouth America | 33.878 |
 Singapore SGPSouth-eastern Asia | 33.716 |
 Denmark DNKNorthern Europe | 33.650 |
 Peru PERSouth America | 33.502 |
 Costa Rica CRICentral America | 33.426 |
 Qatar QATWestern Asia | 32.918 |
 Dominican Republic DOMCaribbean | 31.913 |
 Latvia LVANorthern Europe | 31.873 |
 France FRAWestern Europe | 31.806 |
 Hungary HUNEastern Europe | 31.538 |
 Canada CANNorthern America | 31.430 |
 Mexico MEXCentral America | 31.134 |
 Thailand THASouth-eastern Asia | 30.136 |
 Iran IRNSouthern Asia | 30.093 |
 Lithuania LTUNorthern Europe | 29.820 |
 Spain ESPSouthern Europe | 29.684 |
 Ukraine UKREastern Europe | 29.491 |
 Ecuador ECUSouth America | 29.227 |
 Kyrgyzstan KGZCentral Asia | 29.134 |
 Ireland IRLNorthern Europe | 29.002 |
 Norway NORNorthern Europe | 28.438 |
 Malta MLTSouthern Europe | 28.144 |
 Madagascar MDGEastern Africa | 28.108 |
 Eritrea ERIEastern Africa | 27.807 |
 Luxembourg LUXWestern Europe | 27.575 |
 Belgium BELWestern Europe | 27.482 |
 Germany DEUWestern Europe | 27.140 |
 Finland FINNorthern Europe | 27.058 |
 Mauritania MRTWestern Africa | 27.036 |
 Belarus BLREastern Europe | 26.972 |
 South Korea KOREastern Asia | 26.361 |
 Austria AUTWestern Europe | 25.903 |
 DR Congo CODMiddle Africa | 25.095 |
 Andorra ANDSouthern Europe | 25.000 |
 El Salvador SLVCentral America | 23.901 |
 Mozambique MOZEastern Africa | 23.120 |
 Laos LAOSouth-eastern Asia | 22.427 |
 Switzerland CHEWestern Europe | 22.051 |
 Macau MACEastern Asia | 22.045 |
 Ghana GHAWestern Africa | 20.507 |
 Bangladesh BGDSouthern Asia | 19.776 |
 Chile CHLSouth America | 18.474 |
 Burundi BDIEastern Africa | 18.249 |
Burkina FasoBFAWestern Africa | 16.041 |
02In 2016
At either end
The 5 countries at each end of the headline.
Lowest
- Burkina Faso16.041
- Burundi18.249
- Chile18.474
- Bangladesh19.776
- Ghana20.507
Neither end is better. The values describe a shape, not a score. The middle country reads 34.945. “Shared” marks a value another country also holds.
032015 → 2016
Since 2015
- +16 / −18countries joined / left
- 76values changed, of 76 in both
- 50 · 26rose · fell
- 0unchanged
Rose most
- Niger17.654 → 46.224+28.571
- Andorra0.000 → 25.000+25.000
- Seychelles28.571 → 46.000+17.429
- Luxembourg21.831 → 27.575+5.744
- Oman47.599 → 52.837+5.238
Fell most
- Dominican Republic41.581 → 31.913−9.669
- Armenia42.787 → 36.844−5.943
- Panama48.953 → 43.223−5.730
- Namibia46.568 → 41.933−4.635
- Albania52.780 → 48.296−4.484
+ Aruba+ Burundi+ Bangladesh+ DR Congo+ Cabo Verde+ Cuba+ Egypt+ Georgia+ Greece+ Kazakhstan+ Mongolia+ Mauritania+ Peru+ Qatar+ Singapore+ Syria − Angola
 − Australia
 − Benin
 − Belize
 − Bermuda
 − Grenada
 − Guatemala
 − Cambodia
 − Lesotho
 − Moldova
 − North Macedonia
 − Malaysia
 − North Korea
 − Sudan
 − Slovakia
 − Slovenia
 − Sint Maarten
 − Zimbabwe
Changes in value, not in places: a country’s place also moves when others do.
04Caveats
Read before you use
Nothing missing
Every one of the 92 countries has every column.
05The files
Download and cite
- .csv
For a spreadsheet or code
92 rows · 4.1 KB · UTF-8, opens in Excel
Opens with 11 lines of source notes; the table starts on row 13.
Download female-stem-graduates-2016-nations-inquiry.csv - ↗
The publisher’s original
UIS’s own file, on its own site.
indicators
What this site changed: Reshaped to one row per country, with its ISO code; no value recalculated, rescaled or rounded. In full
Licence: CC BY-SA 4.0 · what it allows, in plain words
Cite this edition
UNESCO Institute for Statistics (UIS) (2016). Female Share of STEM Graduates, 2016 [data set], describing 2016. As held by Nations Inquiry, https://nationsinquiry.com/datasets/female-stem-graduates/2016
0619 held
Other years
‹ The year before
Female Share of STEM Graduates, 201594 countries
The year after ›
Female Share of STEM Graduates, 201782 countries
All of them
Female Share of STEM Graduates: every year19 held, with the data dictionary, coverage and licence.
How it has moved, charted by country