
Photo: tiimta · CC BY-SA 3.0 · via Wikimedia Commons, shown in greyscale
Topic 08 of 18 · Country Index 2026

Australia: Gender & Equality
How wide is the gap between women's and men's lives?
Australia is placed 23rd of 183 countries on gender & equality in the Country Index 2026, from 4 of its 4 key statistics. Readings behind it: Women, Business and the Law 96.88 (2025); Women's Political Empowerment Index 0.906 (2025).
Share
Gender & Equality
23rd
of 183 countries placed
Placed from 4 of 4 key statistics
- 96.88Women, Business and the Law, 2025WBL Index (0–100, where 100 is full legal parity)
- 0.906Women's Political Empowerment Index, 2025Women's political empowerment index (0–1)
- 20.54Firms with a Female Top Manager, 2025Firms with a female top manager (%)
- 15.4Social Institutions and Gender Index, 2023SIGI score (0 = no discrimination, 100 = absolute)
01The evidence
The 4 key statistics that decide it
Only these place Australia on gender & equality — one vote each. Every value is the publisher’s own, read at the edition the Country Index 2026 used — or, for a survey-based key, each country’s latest reading; the grey ticks are every other country it was compared with, lowest on the left.
96.88
WBL Index (0–100, where 100 is full legal parity)
Higher is better
Australia: 96.88. Across the 190 countries in this edition, values run from 3.125 (Afghanistan) to 100 (Sweden); the world median is 81.25.
- World median
- 81.25
- Best in Australia and New Zealand
- 97.5 New Zealand
Key 2 of 4
Women's Political Empowerment Index
V-Dem Institute, University of Gothenburg
2025 edition · data for 2025 · CC BY-SA 4.0
0.906
Women's political empowerment index (0–1)
Higher is better
Australia: 0.906. Across the 176 countries in this edition, values run from 0.028 (Afghanistan) to 0.954 (Denmark); the world median is 0.772.
- World median
- 0.772
- Best in Australia and New Zealand
- 0.937 New Zealand
Key 3 of 4
Firms with a Female Top Manager
World Bank Group
Latest reading per country, 2016–2025 · Australia’s is from 2025 · CC BY 4.0
20.54
Firms with a female top manager (%)
Higher is better
Australia: 20.54. Across the 179 countries at their latest reading, values run from 1.429 (Qatar) to 62.9 (Kiribati); the world median is 19.16.
- World median
- 19.16
- Best in Australia and New Zealand
- 20.54 Australia
Key 4 of 4
Social Institutions and Gender Index
OECD
2023 edition · data for 2023 · OECD Terms and Conditions — data clause
15.4
SIGI score (0 = no discrimination, 100 = absolute)
Lower is better
Australia: 15.4. Across the 140 countries in this edition, values run from 6.7 (Norway) to 67.4 (Mauritania); the world median is 25.2.
- World median
- 25.2
- Best in Australia and New Zealand
- 14 New Zealand
02Over time
Which way Australia is moving
Each key’s published value, edition by edition, beside the world median. The Country Index 2026 is the first edition of the standing, so the standing itself has no history to chart yet.
Women, Business and the Law
WBL Index (0–100, where 100 is full legal parity) · higher is better
AustraliaWorld median
Australia rose from 81.25 in 2000 to 96.88 in 2025; the world median went from 63.13 to 81.25.
Every year’s figures
Year Australia World median 2025 97 81.3 2023 97 81.3 2022 97 80.3 2021 97 80.0 2020 97 79.7 2019 97 78.8 2018 97 77.5 2017 97 77.5 2016 97 76.9 2015 97 75.9 2014 94 75.6 2013 94 75.0 2012 91 73.8 2011 91 73.1 2010 84 73.1 2009 84 72.5 2008 84 71.3 2007 81 69.7 2006 81 68.8 2005 81 67.2 2004 81 66.9 2003 81 64.7 2002 81 63.8 2001 81 63.8 2000 81 63.1 Women's Political Empowerment Index
Women's political empowerment index (0–1) · higher is better
AustraliaWorld median
Australia fell from 0.925 in 2000 to 0.906 in 2025; the world median went from 0.681 to 0.772.
Every year’s figures
Year Australia World median 2025 0.906 0.7715 2024 0.909 0.7745 2023 0.915 0.7755 2022 0.913 0.7825 2021 0.910 0.7785 2020 0.909 0.7755 2019 0.921 0.7665 2018 0.925 0.7715 2017 0.920 0.7710 2016 0.935 0.7780 2015 0.932 0.7755 2014 0.930 0.7795 2013 0.927 0.7730 2012 0.930 0.7740 2011 0.930 0.7650 2010 0.930 0.7610 2009 0.929 0.7515 2008 0.929 0.7505 2007 0.929 0.7380 2006 0.927 0.7290 2005 0.927 0.7350 2004 0.927 0.7205 2003 0.928 0.7160 2002 0.928 0.7150 2001 0.928 0.6950 2000 0.925 0.6810
03In context
Australia beside its neighbours
A position reads best beside the countries around it. Every position below is a place among all 183 countries on gender & equality, never a place within the region.
Australia and Australia and New Zealand
Australia has no land border, so the table compares it with its sub-region. Standing among all 183; the key columns are the publishers’ own values.
| Country | Standing | Women, Business and the LawWBL Index (0–100, where 100 is full legal parity) | Women's Political Empowerment IndexWomen's political empowerment index (0–1) | Firms with a Female Top ManagerFirms with a female top manager (%) | Social Institutions and Gender IndexSIGI score (0 = no discrimination, 100 = absolute) |
|---|---|---|---|---|---|
 New Zealandcompare | 9th | 97.5 | 0.937 | 20.31 | 14 |
| Australia | 23rd | 96.88 | 0.906 | 20.54 | 15.4 |
“—”: no published reading in that edition. What a standing is
Across Australia and New Zealand
Every country in the sub-region, by its place among all 183.
- New Zealand9th
- Australia23rd
Placed either side on gender & equality
The countries immediately above and below Australia in the topic’s list.






04Context, no vote
Where Australia is ahead of the world, and behind
23 more statistics filed under gender & equality, published in full and deliberately given no vote in the standing. Select a row for the publisher, the rank and the links.
Ahead of the world median15
Statistics on which Australia does better than the middle country measured.
Women's Empowerment IndexUNDP Human Development Report Office and UN Women · 2022 · world median 0.6150.8050.615No earlier reading
Australia: 0.805 · world median 0.615 · Women's Empowerment Index (0–1; higher = more empowerment). UNDP Human Development Report Office and UN Women, 2023 edition, data for 2022.
Published values in that edition run from 0.141 to 0.828; higher is better.
Maternal Mortality RatioMMEIG · 2023 · world median 46.652.3346.65▲ Improved since 2013
Australia: 2.33 · world median 46.65 · Maternal deaths per 100,000 live births. UN Maternal Mortality Estimation Inter-Agency Group (MMEIG), 2023 edition, data for 2023.
Published values in that edition run from 0.11 to 992.83; lower is better.
Position 191st of 195 · derived, 1st = worst.
Global Gender Parity IndexUNDP Human Development Report Office and UN Women · 2022 · world median 0.7260.870.726No earlier reading
Australia: 0.87 · world median 0.726 · Global Gender Parity Index (women's achievements relative to men's; 1 = parity). UNDP Human Development Report Office and UN Women, 2023 edition, data for 2022.
Published values in that edition run from 0.141 to 0.925; higher is better.
Gender Social Norms IndexUNDP Human Development Report Office · 2023 · world median 91.8134.8391.81No earlier reading
Australia: 34.83 · world median 91.81 · People with at least one bias against gender equality (%). UNDP Human Development Report Office, 2023 edition, data for 2023.
Published values in that edition run from 27.39 to 99.92; lower is better.
Position 87th of 91 · derived, 1st = worst.
Gender Inequality IndexUNDP Human Development Report Office · 2023 · world median 0.3510.0560.351▲ Improved since 2013
Australia: 0.056 · world median 0.351 · GII (0 = full equality, 1 = maximum inequality). UNDP Human Development Report Office, 2023 edition, data for 2023.
Published values in that edition run from 0.003 to 0.838; lower is better.
Ranked 20th of 172 by UNDP Human Development Report Office.
Demand for Family Planning Satisfied by Modern MethodsUN DESA Population Division · 2023 · world median 71.2585.871.25No real change since 2013
Australia: 85.8 · world median 71.25 · Share of women aged 15–49 wanting to avoid pregnancy who use a modern method (%). UN DESA Population Division, 2023 edition, data for 2023.
Published values in that edition run from 8.4 to 92.4; higher is better.
Position 23rd of 196 · derived.
Account Ownership Among WomenWorld Bank Group · 2024 · world median 71.2497.7271.24▼ Worsened since 2014
Australia: 97.72 · world median 71.24 · Women with an account (% of women aged 15+). World Bank Group, 2024 edition, data for 2024.
Published values in that edition run from 11.91 to 99.85; higher is better.
Position 20th of 139 · derived.
Female Labour Force Participation RateILO · 2025 · world median 53.3662.5153.36▲ Improved since 2015
Australia: 62.51 · world median 53.36 · Women aged 15+ in the labour force (%). International Labour Organization (ILO), 2025 edition, data for 2025.
Published values in that edition run from 4.663 to 82.91; higher is better.
Position 32nd of 182 · derived.
Firms with Female Participation in OwnershipWorld Bank Group · 2026 · world median 35.1249.9135.12No earlier reading
Australia: 49.91 · world median 35.12 · Firms with at least one woman among the owners (%). World Bank Group, 2026 edition, data for 2026.
Published values in that edition run from 1.273 to 86.78; higher is better.
Position 37th of 181 · derived.
Adolescent Birth Rate (Ages 15–19)UN DESA Population Division · 2023 · world median 27.466.71527.46▲ Improved since 2013
Australia: 6.715 · world median 27.46 · Live births per 1,000 women aged 15–19. UN DESA Population Division, 2023 edition, data for 2023.
Published values in that edition run from 0.465 to 163.09; lower is better.
Position 177th of 222 · derived, 1st = worst.
Institutional DeliveriesUNICEF · 2025 · world median 96.999.396.9No earlier reading
Australia: 99.3 · world median 96.9 · Live births delivered in a health facility (%). UNICEF, 2025 edition, data for 2025.
Published values in that edition run from 11.5 to 100; higher is better.
Antenatal Care Coverage, At Least Four VisitsUNICEF · 2025 · world median 819281No earlier reading
Australia: 92 · world median 81 · Women with a live birth who had 4+ antenatal visits (%). UNICEF, 2025 edition, data for 2025.
Published values in that edition run from 22.6 to 100; higher is better.
Position 40th of 153 · derived.
Female Share of Senior and Middle ManagementILO · 2024 · world median 35.8639.3935.86▲ Improved since 2014
Australia: 39.39 · world median 35.86 · Women in senior and middle management (% of managers). International Labour Organization (ILO), 2024 edition, data for 2024.
Published values in that edition run from 7.226 to 56.69; higher is better.
Position 25th of 86 · derived.
Gender Development IndexUNDP Human Development Report Office · 2023 · world median 0.9710.9770.971▲ Improved since 2013
Australia: 0.977 · world median 0.971 · Gender Development Index (1.000 = parity). UNDP Human Development Report Office, 2023 edition, data for 2023.
Published values in that edition run from 0.407 to 1.038; higher is better.
Position 71st of 184 · derived.
Gender Parity Index, Tertiary EnrolmentUIS · 2024 · world median 1.2441.3111.244No real change since 2015
Australia: 1.311 · world median 1.244 · Adjusted gender parity index, tertiary gross enrolment (1 = parity). UNESCO Institute for Statistics (UIS), 2024 edition, data for 2024.
Published values in that edition run from 0.74 to 1.83; higher is better.
Position 61st of 95 · derived.
Behind the world median3
Statistics on which Australia does worse than the middle country measured.
Births Attended by Skilled Health StaffUNICEF and WHO (Joint Database on Skilled Birth Attendance) · 2023 · world median 99.398.599.3▼ Worsened since 2013
Australia: 98.5 · world median 99.3 · Births attended by skilled health staff (%). UNICEF and WHO (Joint Database on Skilled Birth Attendance), 2023 edition, data for 2023.
Published values in that edition run from 60.9 to 100; higher is better.
Position 53rd of 84 · derived.
Length of Paid Paternity LeaveWorld Bank Group · 2025 · world median 303▼ Worsened since 2015
Australia: 0 · world median 3 · Paid paternity leave set in law (calendar days). World Bank Group, 2026 edition, data for 2025.
Published values in that edition run from 0 to 196; higher is better.
Length of Paid Maternity LeaveWorld Bank Group · 2025 · world median 98098No real change since 2015
Australia: 0 · world median 98 · Paid maternity leave set in law (calendar days). World Bank Group, 2026 edition, data for 2025.
Published values in that edition run from 0 to 410; higher is better.
No better end5
These describe the shape of a country — more is not better or worse, only different — so they are never ahead or behind.
Female-Headed HouseholdsUN DESA Population Division · 2026 · world median 33.2144.0733.21No earlier reading
Australia: 44.07 · world median 33.21 · Households headed by a woman (% of households). UN DESA Population Division, 2026 edition, data for 2026.
Published values in that edition run from 5.33 to 64.59.
Mean Age at First Marriage, WomenUN DESA Population Division · 2019 · world median 24.6529.924.65No earlier reading
Australia: 29.9 · world median 24.65 · Singulate mean age at marriage, women (years). UN DESA Population Division, 2019 edition, data for 2019.
Published values in that edition run from 17 to 34.
Caesarean Section RateUNICEF · 2025 · world median 20.6531.120.65No earlier reading
Australia: 31.1 · world median 20.65 · Live births delivered by caesarean section (%). UNICEF, 2025 edition, data for 2025.
Published values in that edition run from 0.6 to 72.2.
Sex Ratio at BirthUN DESA Population Division · 2023 · world median 105.1105.6105.1Moved since 2013
Australia: 105.6 · world median 105.1 · Male births per 100 female births. UN DESA Population Division, 2023 edition, data for 2023.
Published values in that edition run from 101.1 to 116.3.
Female Share of STEM GraduatesUIS · 2023 · world median 35.332.835.3Moved since 2014
Australia: 32.8 · world median 35.3 · STEM graduates who are women (%; 50 = parity). UNESCO Institute for Statistics (UIS), 2023 edition, data for 2023.
Published values in that edition run from 8.333 to 55.96.
No current reading for Australia
Child Marriage, Female Genital Mutilation Prevalence, Female Share of Researchers, Legal Guarantees of Women's Equal Rights to Land, Women Who Think a Husband Is Justified in Hitting or Beating His Wife and Women's Share of Agricultural Landowners. Listed rather than hidden, so the page can be checked against it.
“Position · derived” is this site’s ordering of the published values, 1st = best unless the row says otherwise; the publisher ranks no country on it. Rank, position and standing
05Country Index 2026
Gender & Equality among Australia’s 15 topics
Gender & Equality is Australia’s 5th best-placed topic of 15. Strongest first, each marker at its share of that topic’s field.
- Work & Labourjoint 4th of 1824/4 keys
- Governance & Institutions7th of 1944/4 keys
- Development & Human Capital11th of 1963/3 keys
- Education & Knowledge18th of 1983/4 keys
- Gender & Equality23rd of 1834/4 keys
- Mobility & Trade23rd of 1774/4 keys
- Democracy & Civil Liberties27th of 1984/4 keys
- Digital & Technology30th of 1984/4 keys
- Economy & Innovation27th of 1764/4 keys
- Health & Wellbeing38th of 2003/4 keys
- Risk & Resilience38th of 1934/4 keys
- Peace & Security51st of 1774/4 keys
- Food & Agriculture54th of 1844/4 keys
- Poverty & Inequalityjoint 49th of 1593/3 keys
- Environment & Sustainability80th of 1863/4 keys
No standing on Energy: too few of those topics’ key statistics are published for this country.
06The top of the list
Who leads on gender & equality
The three countries placed highest of 183, and the leaders Australia can most readily be measured against.
 1
 Latvia
Northern Europe
1st of 183 · 4 of 4 keys
Photo: Marcin Szala · CC BY-SA 3.0, greyscale
 2
 Taiwan
Eastern Asia
2nd of 183 · 3 of 4 keys
Photo: xiangyang17 · CC BY-SA 2.0, greyscale
 3
 Italy
Southern Europe
3rd of 183 · 4 of 4 keys
Photo: Francisco Antunes · CC BY 2.0, greyscale
Placed highest nearby
Highest in Oceania
New Zealand9th4/4 keysThis page
Australia23rd4/4 keys
Positions out of 183 placed on the topic. A country needs readings on enough keys to be placed, and the top of the list is often held on fewer of them.
07Questions
Australia on gender & equality: questions answered
Every answer is built from the numbers on this page, so none can say something the page does not.
How does Australia rank on gender & equality?
Australia is placed 23rd of 183 countries on Gender & Equality in the Country Index 2026, from 4 of its 4 key statistics (Women, Business and the Law, Women's Political Empowerment Index, Firms with a Female Top Manager and Social Institutions and Gender Index). The position is this site’s ordering of published statistics, not a rank any publisher printed.
What is the latest Women, Business and the Law figure for Australia?
96.88 in 2025 (wBL Index (0–100, where 100 is full legal parity)), according to World Bank Group. The world median in the same edition was 81.25.
What is the latest Women's Political Empowerment Index figure for Australia?
0.906 in 2025 (women's political empowerment index (0–1)), according to V-Dem Institute, University of Gothenburg. The world median in the same edition was 0.772.
How have Australia’s gender & equality figures changed?
Women, Business and the Law rose from 81.25 in 2000 to 96.88 in 2025; Women's Political Empowerment Index fell from 0.925 in 2000 to 0.906 in 2025.
Which gender & equality statistics are missing for Australia?
No current reading is published for Australia on Child Marriage, Female Genital Mutilation Prevalence, Female Share of Researchers, Legal Guarantees of Women's Equal Rights to Land, Women Who Think a Husband Is Justified in Hitting or Beating His Wife and Women's Share of Agricultural Landowners. They are listed rather than hidden, so the evidence on the page can be checked against it.
08Method
Method, sources and how to cite
What this topic does not measure
Violence against women is not a key here, because comparable data covers too few countries. The Gender Inequality Index is published here as context rather than as a key: its reading is driven largely by maternal and adolescent health, which moves with a country’s overall development and is already measured under Development and Health. Women’s labour force participation, women in management and child marriage are published here as context too.
How the Gender & Equality standing is decided
A standing is this site’s ordering, named with its edition — never a publisher’s rank. 4 key statistics vote, one vote each; every country’s published value becomes a place within that key’s own field, the places are averaged, and the average is never published. A country needs 2 of the 4 keys to be placed.
The gender & equality method, step by stepHow every standing on this site is built
The key statistics and their licences
- Women, Business and the Law — World Bank Group, CC BY 4.0
- Women's Political Empowerment Index — V-Dem Institute, University of Gothenburg, CC BY-SA 4.0
- Firms with a Female Top Manager — World Bank Group, CC BY 4.0
- Social Institutions and Gender Index — OECD, OECD Terms and Conditions — data clause
The other 23 statistics on this page come from 9 publishers, each named beside its numbers, with every edition and licence on the datasets pages.
The standing itself is part of the Country Index 2026, published under CC BY-SA 4.0.
Photographs
Australia’s banner and the countries placed highest, from their profiles: Wikimedia Commons, shown in greyscale, each used under the licence named.
- Australia (banner) — tiimta, CC BY-SA 3.0
- Latvia — Marcin Szala, CC BY-SA 3.0
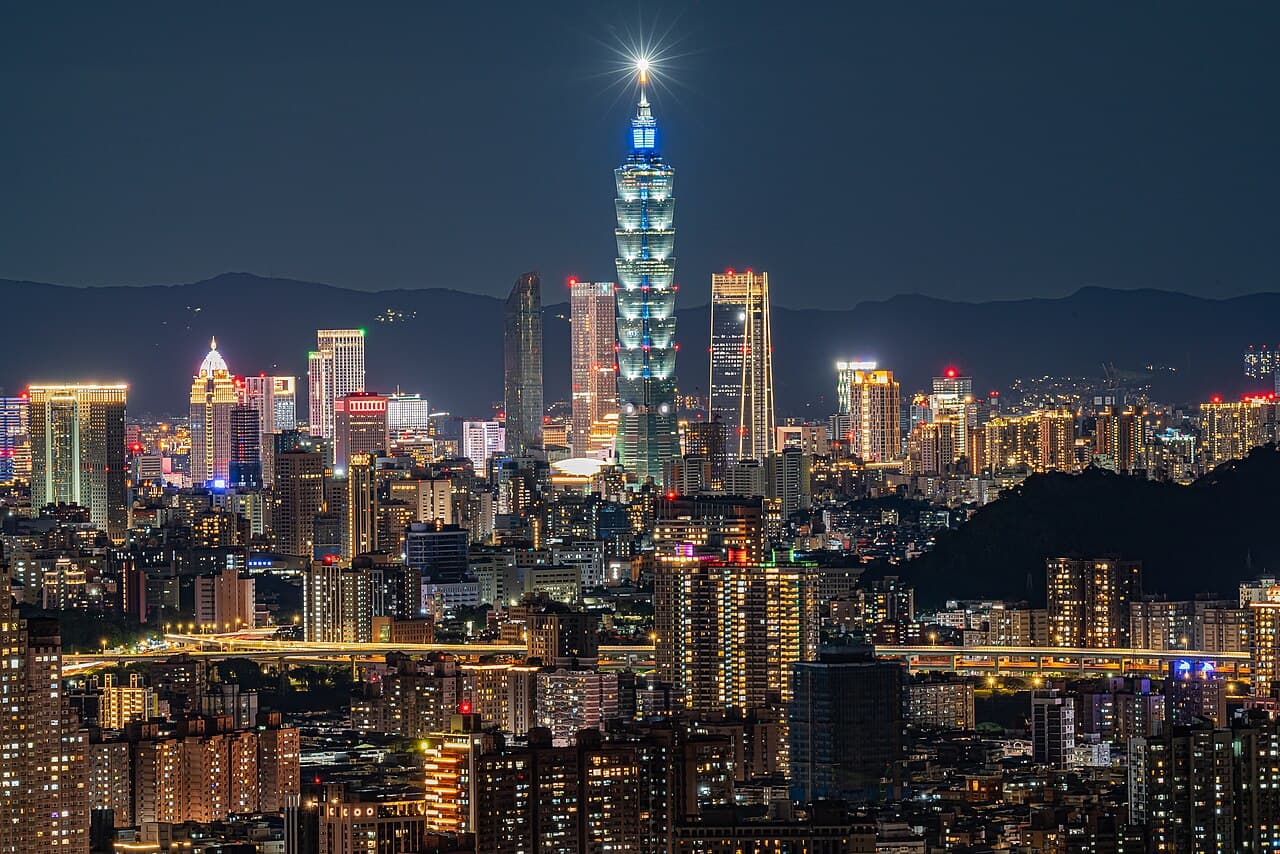
- Taiwan — xiangyang17, CC BY-SA 2.0
- Italy — Francisco Antunes, CC BY 2.0
Cite this page
Nations Inquiry (2026). Australia: Gender & Equality — standing and statistics, Country Index 2026. https://nationsinquiry.com/countries/australia/gender