Data for 2015
RISE Clean Cooking Policy Score, 2015
2015, as ESMAP’s 2024 release gives it · stored as published, never rewritten
The RISE clean cooking score rates the plans, incentives and standards a country has for moving households from wood, charcoal and kerosene to clean cooking fuels and stoves, on a scale of 0 to 100. It is published by the World Bank's Energy Sector Management Assistance Program and measures the policy, not how many households cook cleanly.
RISE Clean Cooking Policy Score, 2015 covers 57 countries on 5 measures. China is highest, at 49.7; 6 countries share the lowest reading, 0.0. The middle country reads 7.8. Against 2014, 43 values changed (29 up, 14 down), the same countries are covered.
RISE Clean Cooking Policy Score · Data for 2015
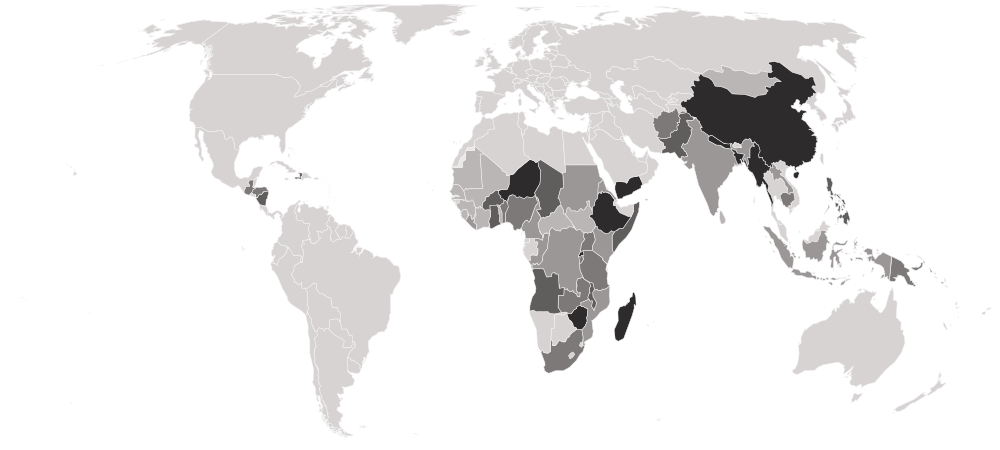
HighestChina
49.7Lowest6 countries share it
0.0Shaded by value in five groups of equal size, darkest at the better end.
01Values only
The table
Every country and every column of RISE Clean Cooking Policy Score, 2015, as published. The file carries values only, so no position is shown. “=” marks a shared position.
Showing 25 of 57 countries · select a heading to sort
ChinaCHNEastern Asia | 49.7 | 62 | 50 | 17 | 70 |
 Yemen YEMWestern Asia | 46.7 | 73 | 63 | 50 | 0 |
 Madagascar MDGEastern Africa | 42.6 | 53 | 62 | 17 | 38 |
 Myanmar MMRSouth-eastern Asia | 36.1 | 56 | 56 | 0 | 33 |
 Bangladesh BGDSouthern Asia | 32.4 | 53 | 68 | 8 | 0 |
 Zimbabwe ZWEEastern Africa | 29.6 | 67 | 37 | 8 | 7 |
 Nepal NPLSouthern Asia | 29.3 | 13 | 62 | 42 | 0 |
 Niger NERWestern Africa | 28.9 | 38 | 61 | 17 | 0 |
 Ethiopia ETHEastern Africa | 27.6 | 44 | 24 | 42 | 0 |
 Rwanda RWAEastern Africa | 26.7 | 18 | 31 | 33 | 24 |
 Pakistan PAKSouthern Asia | 25.1 | 29 | 50 | 8 | 13 |
 Philippines PHLSouth-eastern Asia | 24.7 | 73 | 26 | 0 | 0 |
 Maldives MDVSouthern Asia | 22.8 | 33 | 11 | 0 | 47 |
 Haiti HTICaribbean | 21.1 | 22 | 39 | 8 | 15 |
 Ghana GHAWestern Africa | 20.6 | 60 | 0 | 17 | 6 |
 Somalia SOMEastern Africa | 19.9 | 49 | 6 | 25 | 0 |
 Angola AGOMiddle Africa | 18.1 | 53 | 19 | 0 | 0 |
 Malawi MWIEastern Africa | 17.1 | 0 | 0 | 25 | 43 |
 Burkina Faso BFAWestern Africa | 15.8 | 40 | 23 | 0 | 0 |
 Chad TCDMiddle Africa | 15.8 | 40 | 7 | 17 | 0 |
 Nicaragua NICCentral America | 13.6 | 0 | 19 | 17 | 19 |
 Nigeria NGAWestern Africa | 12.5 | 11 | 39 | 0 | 0 |
 Zambia ZMBEastern Africa | 12.5 | 44 | 6 | 0 | 0 |
 Guatemala GTMCentral America | 11.0 | 36 | 0 | 8 | 0 |
 Tanzania TZAEastern Africa | 10.0 | 40 | 0 | 0 | 0 |
 South Africa ZAFSouthern Africa | 9.4 | 27 | 11 | 0 | 0 |
 Benin BENWestern Africa | 9.2 | 20 | 0 | 17 | 0 |
 Afghanistan AFGSouthern Asia | 8.3 | 0 | 0 | 0 | 33 |
 Papua New Guinea PNGMelanesia | 7.8 | 20 | 11 | 0 | 0 |
 Cambodia KHMSouth-eastern Asia | 7.5 | 13 | 0 | 17 | 0 |
 Burundi BDIEastern Africa | 6.4 | 20 | 6 | 0 | 0 |
 Uganda UGAEastern Africa | 6.4 | 7 | 19 | 0 | 0 |
 Honduras HNDCentral America | 6.3 | 0 | 0 | 25 | 0 |
 DR Congo CODMiddle Africa | 6.1 | 24 | 0 | 0 | 0 |
 Sudan SDNNorthern Africa | 6.1 | 11 | 13 | 0 | 0 |
 Cameroon CMRMiddle Africa | 5.6 | 22 | 0 | 0 | 0 |
 India INDSouthern Asia | 5.6 | 22 | 0 | 0 | 0 |
 Indonesia IDNSouth-eastern Asia | 5.6 | 22 | 0 | 0 | 0 |
 Kenya KENEastern Africa | 5.6 | 22 | 0 | 0 | 0 |
 Laos LAOSouth-eastern Asia | 5.6 | 22 | 0 | 0 | 0 |
 Liberia LBRWestern Africa | 5.6 | 22 | 0 | 0 | 0 |
 Eritrea ERIEastern Africa | 5.0 | 13 | 7 | 0 | 0 |
 Mozambique MOZEastern Africa | 5.0 | 20 | 0 | 0 | 0 |
 Solomon Islands SLBMelanesia | 5.0 | 20 | 0 | 0 | 0 |
 Republic of the Congo COGMiddle Africa | 4.4 | 7 | 11 | 0 | 0 |
 Vanuatu VUTMelanesia | 3.8 | 7 | 0 | 8 | 0 |
 Central African Republic CAFMiddle Africa | 3.5 | 0 | 6 | 8 | 0 |
 Sri Lanka LKASouthern Asia | 3.1 | 7 | 6 | 0 | 0 |
 Mongolia MNGEastern Asia | 2.8 | 11 | 0 | 0 | 0 |
 Mauritania MRTWestern Africa | 1.7 | 7 | 0 | 0 | 0 |
 Senegal SENWestern Africa | 1.7 | 7 | 0 | 0 | 0 |
 Côte d’Ivoire CIVWestern Africa | 0.0 | 0 | 0 | 0 | 0 |
 Guinea GINWestern Africa | 0.0 | 0 | 0 | 0 | 0 |
 Mali MLIWestern Africa | 0.0 | 0 | 0 | 0 | 0 |
 Sierra Leone SLEWestern Africa | 0.0 | 0 | 0 | 0 | 0 |
 South Sudan SSDEastern Africa | 0.0 | 0 | 0 | 0 | 0 |
 Togo TGOWestern Africa | 0.0 | 0 | 0 | 0 | 0 |
02In 2015
At either end
The 5 countries at each end of the headline, then the highest and lowest on each other measure.
Highest
- China49.7
- Yemen46.7
- Madagascar42.6
- Myanmar36.1
- Bangladesh32.4
Lowest
- Togoshared0.0
- South Sudanshared0.0
- Sierra Leoneshared0.0
- Malishared0.0
- Guineashared0.0
A higher value is the better result. The middle country reads 7.8. “Shared” marks a value another country also holds.
Each measure’s ends
Clean cooking national planning
Highest2 share it
Lowest11 share it
Middle country: 20
Implementation scope of clean cooking planning
Highest
Bangladesh68Lowest27 share it
Middle country: 6
Incentives and attributes for clean cooking
Highest
Yemen50Lowest35 share it
Middle country: 0
Standards and labelling
Highest
China70Lowest45 share it
Middle country: 0
032014 → 2015
Since 2014
- +0 / −0countries joined / left
- 43values changed, of 57 in both
- 29 · 14rose · fell
- 14unchanged
Rose most
- Yemen0.0 → 46.7+46.7
- Madagascar1.7 → 42.6+41.0
- Myanmar1.7 → 36.1+34.4
- Pakistan1.7 → 25.1+23.5
- Philippines5.0 → 24.7+19.7
Fell most
- Tanzania46.7 → 10.0−36.7
- Indonesia40.6 → 5.6−35.0
- Mali34.4 → 0.0−34.4
- Mauritania27.6 → 1.7−26.0
- Mozambique28.9 → 5.0−23.9
04Caveats
Read before you use
One year of the 2024 release
Every year in this series comes from ESMAP’s 2024 release, recalculated on one method, so a change from one year to the next is not a revision. It can differ from what was first published for 2015.
40 distinct values among 57
Values are stored exactly as published, to 16 decimals. 6 countries share 5.6. Countries sharing a value share a position too.
Nothing missing
Every one of the 57 countries has every column.
05The files
Download and cite
- .csv
For a spreadsheet or code
57 rows · 4.9 KB · UTF-8, opens in Excel
Opens with 11 lines of source notes; the table starts on row 13.
Download rise-clean-cooking-2015-nations-inquiry.csv - ↗
The publisher’s original
ESMAP’s own file, on its own site.
WB_RISE_WIDEF.csv
What this site changed: Reshaped to one row per country, with its ISO code; no value recalculated, rescaled or rounded. In full
Licence: CC BY 4.0 · what it allows, in plain words
Cite this edition
World Bank Group (ESMAP) (2015). RISE Clean Cooking Policy Score, 2015 [data set], describing 2015. As held by Nations Inquiry, https://nationsinquiry.com/datasets/rise-clean-cooking/2015
0614 held
Other years
‹ The year before
RISE Clean Cooking Policy Score, 201457 countries
The year after ›
RISE Clean Cooking Policy Score, 201657 countries
All of them
RISE Clean Cooking Policy Score: every year14 held, with the data dictionary, coverage and licence.
How it has moved, charted by country