Data for 2010
Average Monthly Earnings of Employees, 2010
2010, as ILO’s 2026 release gives it · stored as published, never rewritten
This is what employees earn in a month on average, before tax, converted by the International Labour Organization into dollars of equal purchasing power so that a month’s pay can be compared across countries with very different prices.
Average Monthly Earnings of Employees, 2010 covers 93 countries on 3 measures. Luxembourg is highest, at 4,608.35; Niger is lowest, at 109.60. The middle country reads 1,071.63. Against 2009, 79 values changed (60 up, 19 down), 14 countries joined, 8 left.
Average Monthly Earnings of Employees · Data for 2010

HighestLuxembourg
4,608.35
LowestNiger
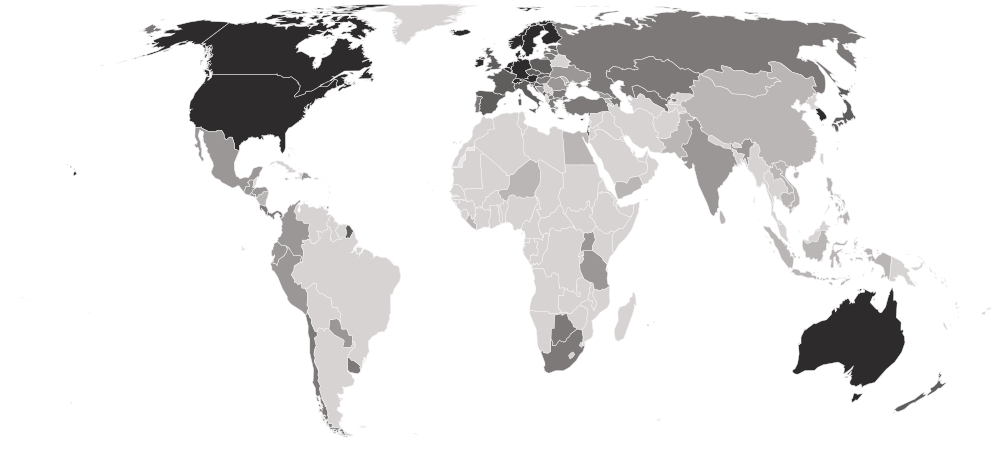
109.60Shaded by value in five groups of equal size, darkest at the better end.
01Position · derived
The table
Every country and every column of Average Monthly Earnings of Employees, 2010, as published. ILO ranks nobody on this measure; the position is derived here by ordering the published values. “=” marks a shared position.
Showing 25 of 93 countries · select a heading to sort
| derived | |||||
|---|---|---|---|---|---|
| 1 | LuxembourgLUXWestern Europe | 4,608.35 | 3,671.81 | 5,347.1 | — |
| 2 |  Belgium BELWestern Europe | 4,489.50 | 3,775.27 | 5,128.6 | — |
| 3 |  Netherlands NLDWestern Europe | 4,175.52 | 3,085.78 | 5,103.2 | — |
| 4 |  Austria AUTWestern Europe | 3,936.65 | 3,078.86 | 4,622.0 | — |
| 5 |  Singapore SGPSouth-eastern Asia | 3,819.53 | 3,207.70 | 4,377.2 | — |
| 6 |  Norway NORNorthern Europe | 3,610.25 | 2,840.88 | 4,351.8 | — |
| 7 |  Finland FINNorthern Europe | 3,525.36 | 3,071.45 | 3,990.5 | — |
| 8 |  Switzerland CHEWestern Europe | 3,523.18 | 2,569.14 | 4,372.7 | — |
| 9 |  Ireland IRLNorthern Europe | 3,467.68 | 2,870.75 | 4,101.4 | — |
| 10 |  Denmark DNKNorthern Europe | 3,447.69 | 3,134.17 | 3,760.2 | — |
| 11 |  United States USANorthern America | 3,389.02 | 2,877.93 | 3,879.6 | — |
| 12 |  South Korea KOREastern Asia | 3,067.22 | 2,223.06 | 3,479.6 | — |
| 13 |  Sweden SWENorthern Europe | 2,927.51 | 2,490.70 | 3,351.8 | — |
| 14 |  Iceland ISLNorthern Europe | 2,912.74 | 2,328.60 | 3,479.4 | — |
| 15 |  Germany DEUWestern Europe | 2,872.83 | 2,131.02 | 3,527.8 | — |
| 16 |  Canada CANNorthern America | 2,813.78 | 2,386.44 | 3,243.0 | — |
| 17 |  Cyprus CYPWestern Asia | 2,787.72 | 2,246.27 | 3,302.2 | — |
| 18 |  Australia AUSAustralia and New Zealand | 2,773.80 | 2,165.67 | 3,331.2 | — |
| 19 |  Slovenia SVNSouthern Europe | 2,665.78 | 2,518.07 | 2,797.9 | — |
| 20 |  United Kingdom GBRNorthern Europe | 2,498.77 | 1,948.28 | 3,058.1 | — |
| 21 |  Malta MLTSouthern Europe | 2,497.17 | 2,237.30 | 2,655.6 | — |
| 22 |  New Zealand NZLAustralia and New Zealand | 2,469.68 | 2,012.10 | 2,908.5 | — |
| 23 |  Japan JPNEastern Asia | 2,447.29 | 1,880.50 | 2,712.5 | — |
| 24 |  Spain ESPSouthern Europe | 2,294.99 | 1,991.66 | 2,558.3 | — |
| 25 |  Croatia HRVSouthern Europe | 2,170.48 | 2,005.03 | 2,322.4 | — |
| 26 |  Hong Kong HKGEastern Asia | 1,988.51 | 1,626.96 | 2,169.3 | — |
| 27 |  France FRAWestern Europe | 1,936.69 | 1,674.27 | 2,193.9 | — |
| 28 |  Czechia CZEEastern Europe | 1,901.21 | 1,593.52 | 2,163.3 | — |
| 29 |  Aruba ABWCaribbean | 1,860.38 | 1,675.15 | 2,061.1 | — |
| 30 |  Israel ISRWestern Asia | 1,857.07 | 1,464.10 | 2,228.5 | — |
| 31 |  Estonia ESTNorthern Europe | 1,772.88 | 1,468.75 | 2,131.2 | — |
| 32 |  Macau MACEastern Asia | 1,767.81 | 1,489.72 | 1,986.3 | — |
| 33 |  Slovakia SVKEastern Europe | 1,625.39 | 1,435.92 | 1,805.6 | — |
| 34 |  Montenegro MNESouthern Europe | 1,561.36 | — | — | — |
| 35 |  Italy ITASouthern Europe | 1,522.53 | 1,338.35 | 1,666.6 | — |
| 36 |  Poland POLEastern Europe | 1,489.87 | 1,371.14 | 1,597.5 | — |
| 37 |  Latvia LVANorthern Europe | 1,471.92 | 1,352.16 | 1,610.0 | — |
| 38 |  Lithuania LTUNorthern Europe | 1,395.10 | 1,302.64 | 1,508.1 | — |
| 39 |  Hungary HUNEastern Europe | 1,387.78 | 1,296.19 | 1,472.9 | — |
| 40 |  Greece GRCSouthern Europe | 1,359.09 | 1,253.41 | 1,443.1 | — |
| 41 |  North Macedonia MKDSouthern Europe | 1,284.79 | — | — | — |
| 42 |  Russia RUSEastern Europe | 1,253.61 | — | — | — |
| 43 |  South Africa ZAFSouthern Africa | 1,147.00 | 980.11 | 1,276.9 | — |
| 44 |  Botswana BWASouthern Africa | 1,144.93 | 1,100.77 | 1,178.7 | — |
| 45 |  Portugal PRTSouthern Europe | 1,104.81 | 1,025.73 | 1,187.2 | — |
| 46 |  Costa Rica CRICentral America | 1,090.12 | 1,021.14 | 1,136.7 | — |
| 47 |  Azerbaijan AZEWestern Asia | 1,071.63 | — | — | — |
| 48 |  Kazakhstan KAZCentral Asia | 1,029.97 | 813.15 | 1,232.2 | — |
| 49 |  Trinidad and Tobago TTOCaribbean | 1,020.93 | 947.47 | 1,078.2 | Break in series |
| 50 |  Chile CHLSouth America | 997.04 | 828.04 | 1,122.4 | — |
| 51 |  Panama PANCentral America | 959.01 | 937.49 | 973.2 | Break in series |
| 52 |  Türkiye TURWestern Asia | 928.21 | 902.35 | 936.1 | — |
| 53 |  Uruguay URYSouth America | 884.03 | 743.19 | 1,004.6 | — |
| 54 |  Uzbekistan UZBCentral Asia | 882.39 | — | — | — |
| 55 |  Bulgaria BGREastern Europe | 880.95 | 811.77 | 943.1 | — |
| 56 |  Seychelles SYCEastern Africa | 843.73 | — | — | Break in series |
| 57 |  Uganda UGAEastern Africa | 815.20 | 595.65 | 914.5 | — |
| 58 |  Kosovo XKXSouthern Europe | 804.55 | — | — | — |
| 59 |  Mauritius MUSEastern Africa | 789.63 | 610.34 | 895.0 | — |
| 60 |  Bosnia and Herzegovina BIHSouthern Europe | 789.21 | 743.15 | 815.4 | — |
| 61 |  Tanzania TZAEastern Africa | 762.21 | 756.37 | 764.8 | — |
| 62 |  Georgia GEOWestern Asia | 752.85 | 537.42 | 935.8 | — |
| 63 |  Romania ROUEastern Europe | 741.36 | 672.82 | 792.1 | — |
| 64 |  Ukraine UKREastern Europe | 736.44 | 649.28 | 834.8 | — |
| 65 |  Colombia COLSouth America | 664.43 | 640.25 | 681.9 | Break in series |
| 66 |  India INDSouthern Asia | 662.19 | 525.34 | 692.7 | — |
| 67 |  Peru PERSouth America | 658.72 | 543.42 | 731.6 | — |
| 68 |  Ecuador ECUSouth America | 655.47 | 632.45 | 667.7 | — |
| 69 |  Paraguay PRYSouth America | 652.18 | 546.37 | 715.2 | — |
| 70 |  Honduras HNDCentral America | 630.73 | 684.45 | 603.1 | — |
| 71 |  Guatemala GTMCentral America | 573.20 | 534.47 | 589.7 | Break in series |
| 72 |  Dominican Republic DOMCaribbean | 559.43 | 511.13 | 600.9 | — |
| 73 |  El Salvador SLVCentral America | 558.05 | 568.88 | 551.7 | Break in series |
| 74 |  Mexico MEXCentral America | 551.73 | 498.55 | 582.7 | — |
| 75 |  Yemen YEMWestern Asia | 541.79 | 460.34 | 547.1 | — |
| 76 |  Philippines PHLSouth-eastern Asia | 503.42 | 507.91 | 500.4 | — |
| 77 |  Armenia ARMWestern Asia | 498.26 | 376.40 | 580.4 | — |
| 78 |  Jamaica JAMCaribbean | 484.67 | 457.01 | 514.1 | — |
| 79 |  Liberia LBRWestern Africa | 484.66 | 504.35 | 478.8 | Break in series |
| 80 |  China CHNEastern Asia | 478.73 | — | — | — |
| 81 |  Mongolia MNGEastern Asia | 473.46 | 438.03 | 509.5 | — |
| 82 |  Egypt EGYNorthern Africa | 473.13 | 373.66 | 498.3 | — |
| 83 |  Nicaragua NICCentral America | 433.94 | — | — | — |
| 84 |  Vietnam VNMSouth-eastern Asia | 383.02 | 347.69 | 406.9 | — |
| 85 |  Timor-Leste TLSSouth-eastern Asia | 380.80 | 381.38 | 380.6 | Break in series |
| 86 |  Pakistan PAKSouthern Asia | 380.41 | 258.78 | 397.2 | — |
| 87 |  Laos LAOSouth-eastern Asia | 371.14 | 321.02 | 397.9 | Break in series |
| 88 |  Moldova MDAEastern Europe | 362.11 | 336.72 | 392.3 | — |
| 89 |  Indonesia IDNSouth-eastern Asia | 360.34 | 302.83 | 391.6 | — |
| 90 |  Vanuatu VUTMelanesia | 342.32 | 287.90 | 374.9 | — |
| 91 |  Sri Lanka LKASouthern Asia | 330.89 | 285.80 | 352.8 | Break in series |
| 92 |  Cambodia KHMSouth-eastern Asia | 255.80 | 218.91 | 281.5 | — |
| 93 | NigerNERWestern Africa | 109.60 | — | — | — |
02In 2010
At either end
The 5 countries at each end of the headline, then the highest and lowest on each other measure.
Highest
- 1Luxembourg4,608.35
- 2Belgium4,489.50
- 3Netherlands4,175.52
- 4Austria3,936.65
- 5Singapore3,819.53
A higher value is the better result. The middle country reads 1,071.63. “Shared” marks a value another country also holds.
Each measure’s ends
Women (2021 PPP $)
Highest
Belgium3,775.27Lowest
Cambodia218.91Middle country: 1,021.14
Men (2021 PPP $)
Highest
Luxembourg5,347.1Lowest
Cambodia281.5Middle country: 1,187.2
032009 → 2010
Since 2009
- +14 / −8countries joined / left
- 79values changed, of 79 in both
- 60 · 19rose · fell
- 0unchanged
Rose most
- Uganda302.70 → 815.20+512.50
- Croatia1,761.48 → 2,170.48+409.00
- Egypt163.67 → 473.13+309.47
- Ireland3,173.71 → 3,467.68+293.98
- Montenegro1,343.30 → 1,561.36+218.06
+ Aruba+ Costa Rica+ Guatemala+ India+ Laos+ Liberia+ El Salvador+ Timor-Leste+ Trinidad and Tobago+ Tanzania+ Uzbekistan+ Vanuatu+ Yemen+ South Africa − United Arab Emirates
 − Bolivia
 − Brazil
 − Republic of the Congo
 − Kyrgyzstan
 − Qatar
 − Saudi Arabia
 − Tajikistan
04Caveats
Read before you use
One year of the 2026 release
Every year in this series comes from ILO’s 2026 release, recalculated on one method, so a change from one year to the next is not a revision. It can differ from what was first published for 2010.
103 empty cells
An empty cell means the publisher gave no figure. It is never a zero.
Some readings carry a flag
ILO marks readings it considers estimates or provisional. The flags in this file: Break in series.
05The files
Download and cite
- .csv
For a spreadsheet or code
93 rows · 5.0 KB · UTF-8, opens in Excel
Opens with 11 lines of source notes; the table starts on row 13.
Download average-monthly-earnings-2010-nations-inquiry.csv - ↗
The publisher’s original
ILO’s own file, on its own site.
https://rplumber.ilo.org/data/indicator/?id=EAR_EMTA_SEX_CUR_NB&format=.csv&channel=ilostat
What this site changed: Reshaped to one row per country, with its ISO code; no value recalculated, rescaled or rounded. In full
Licence: CC BY 4.0 · what it allows, in plain words
Cite this edition
International Labour Organization (ILO) (2010). Average Monthly Earnings of Employees, 2010 [data set], describing 2010. As held by Nations Inquiry, https://nationsinquiry.com/datasets/average-monthly-earnings/2010
0622 held
Other years
‹ The year before
Average Monthly Earnings of Employees, 200987 countries
The year after ›
Average Monthly Earnings of Employees, 201196 countries
All of them
Average Monthly Earnings of Employees: every year22 held, with the data dictionary, coverage and licence.
How it has moved, charted by country