Data for 2023
RISE Electricity Access Policy Score, 2023
2023, as ESMAP’s 2024 release gives it · stored as published, never rewritten
The RISE electricity access score rates the laws, plans and regulations a country has for bringing electricity to people who lack it — national electrification planning, rules for the grid, for mini-grids and for solar home systems, and measures to keep power affordable — on a scale of 0 to 100. It is published by the World Bank's Energy Sector Management Assistance Program.
RISE Electricity Access Policy Score, 2023 covers 56 countries on 6 measures. Nigeria is highest, at 90.47; Yemen is lowest, at 9.47. The middle country reads 65.67. Against 2022, 38 values changed (32 up, 6 down), the same countries are covered.
RISE Electricity Access Policy Score · Data for 2023
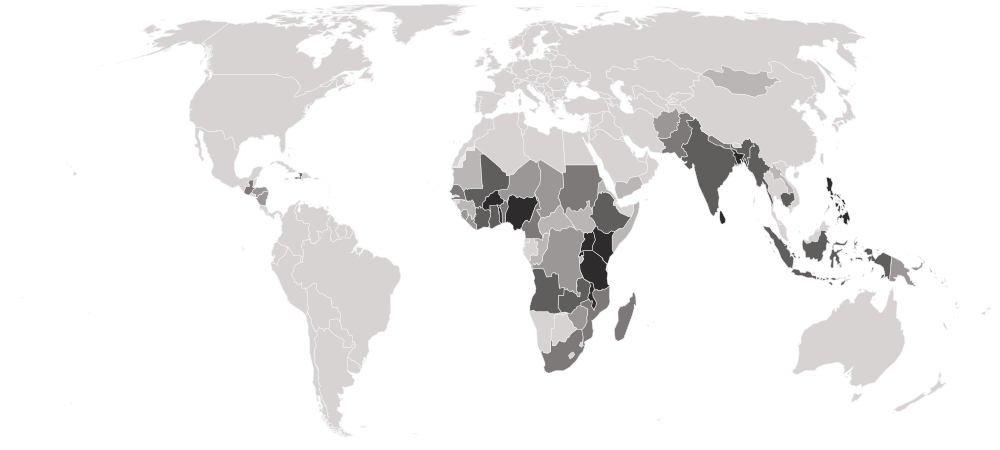

HighestNigeria
90.47
LowestYemen
9.47Shaded by value in five groups of equal size, darkest at the better end.
01Position · derived
The table
Every country and every column of RISE Electricity Access Policy Score, 2023, as published. ESMAP ranks nobody on this measure; the position is derived here by ordering the published values. “=” marks a shared position.
Showing 25 of 56 countries · select a heading to sort
| derived | |||||||
|---|---|---|---|---|---|---|---|
| 1 | NigeriaNGAWestern Africa | 90.47 | 90.5 | 83 | 95.2 | 100 | 83.3167 |
| 2 |  Rwanda RWAEastern Africa | 90.20 | 93.3 | 100 | 95.2 | 100 | 62.4300 |
| 3 |  Tanzania TZAEastern Africa | 89.91 | 95.2 | 100 | 86.8 | 72 | 95.3333 |
| 4 |  Kenya KENEastern Africa | 89.23 | 100.0 | 100 | 100.0 | 100 | 46.1700 |
| 5 |  Uganda UGAEastern Africa | 84.55 | 100.0 | 100 | 86.8 | 67 | 69.3333 |
| 6 |  Sri Lanka LKASouthern Asia | 82.39 | 100.0 | 100 | 51.9 | 61 | 99.0000 |
| 7 |  Malawi MWIEastern Africa | 80.76 | 95.2 | 100 | 77.2 | 72 | 59.0867 |
| 8 |  Burkina Faso BFAWestern Africa | 79.99 | 90.5 | 83 | 70.9 | 56 | 99.6667 |
| 9 |  Togo TGOWestern Africa | 79.76 | 72.4 | 83 | 63.5 | 100 | 79.6000 |
| 10 |  Philippines PHLSouth-eastern Asia | 79.47 | 57.1 | 67 | 73.5 | 100 | 99.9987 |
| 11 |  Bangladesh BGDSouthern Asia | 78.75 | 93.3 | 50 | 67.2 | 100 | 83.2400 |
| 12 |  Cambodia KHMSouth-eastern Asia | 78.64 | 67.6 | 100 | 59.3 | 83 | 82.9733 |
| 13 |  Angola AGOMiddle Africa | 77.44 | 81.9 | 67 | 83.1 | 56 | 99.9953 |
| 14 |  Zambia ZMBEastern Africa | 76.91 | 75.2 | 100 | 83.1 | 56 | 70.6667 |
| 15 |  Côte d’Ivoire CIVWestern Africa | 76.71 | 93.3 | 100 | 73.5 | 33 | 83.3333 |
| 16 |  Ghana GHAWestern Africa | 75.91 | 79.0 | 67 | 60.3 | 78 | 95.7400 |
| 17 |  Indonesia IDNSouth-eastern Asia | 73.52 | 81.9 | 83 | 63.5 | 56 | 83.3332 |
| 18 |  Myanmar MMRSouth-eastern Asia | 72.26 | 93.3 | 33 | 62.4 | 89 | 83.3313 |
| 19 |  Ethiopia ETHEastern Africa | 72.19 | 95.2 | 50 | 77.2 | 78 | 60.6667 |
| 20 |  Mali MLIWestern Africa | 71.14 | 95.2 | 33 | 61.4 | 83 | 82.3967 |
| 21 |  Haiti HTICaribbean | 71.06 | 55.2 | 50 | 67.7 | 100 | 82.3333 |
| 22 |  India INDSouthern Asia | 70.39 | 92.0 | 90 | 30.1 | 60 | 79.9189 |
| 23 |  Senegal SENWestern Africa | 69.88 | 88.6 | 50 | 83.1 | 61 | 66.6667 |
| 24 |  Pakistan PAKSouthern Asia | 69.26 | 88.6 | 67 | 19.6 | 72 | 99.2733 |
| 25 |  Sudan SDNNorthern Africa | 68.71 | 60.0 | 83 | 61.4 | 56 | 83.3033 |
| 26 |  Mozambique MOZEastern Africa | 67.03 | 56.2 | 17 | 64.0 | 100 | 98.2733 |
| 27 |  Nepal NPLSouthern Asia | 66.14 | 33.3 | 67 | 64.0 | 83 | 83.3263 |
| 28 |  Maldives MDVSouthern Asia | 65.84 | 76.2 | 100 | 54.0 | 33 | 65.7211 |
| 29 |  Benin BENWestern Africa | 65.50 | 76.2 | 33 | 61.4 | 67 | 89.9300 |
| 30 |  Guatemala GTMCentral America | 65.25 | 81.0 | 50 | 51.9 | 61 | 82.3333 |
| 31 |  South Africa ZAFSouthern Africa | 64.59 | 95.2 | 83 | 27.0 | 61 | 56.2800 |
| 32 |  Madagascar MDGEastern Africa | 63.72 | 39.0 | 67 | 57.7 | 56 | 99.6667 |
| 33 |  Cameroon CMRMiddle Africa | 61.67 | 67.6 | 50 | 57.7 | 50 | 83.0433 |
| 34 |  Liberia LBRWestern Africa | 60.84 | 90.5 | 17 | 58.2 | 56 | 83.3133 |
| 35 |  Niger NERWestern Africa | 60.19 | 81.9 | 33 | 65.1 | 56 | 65.0867 |
| 36 |  Chad TCDMiddle Africa | 55.42 | 48.6 | 67 | 44.4 | 67 | 50.7743 |
| 37 |  Nicaragua NICCentral America | 55.00 | 44.8 | 67 | 31.2 | 50 | 82.3333 |
| 38 |  DR Congo CODMiddle Africa | 54.81 | 9.5 | 17 | 86.8 | 78 | 83.3311 |
| 39 |  Afghanistan AFGSouthern Asia | 54.56 | 50.5 | 33 | 45.5 | 61 | 82.3878 |
| 40 |  Papua New Guinea PNGMelanesia | 52.36 | 54.3 | 67 | 25.4 | 56 | 59.9067 |
| 41 |  Vanuatu VUTMelanesia | 50.65 | 66.7 | 33 | 29.1 | 56 | 68.6000 |
| 42 |  Sierra Leone SLEWestern Africa | 48.61 | 74.3 | 33 | 68.8 | 50 | 16.6667 |
| 43 |  Zimbabwe ZWEEastern Africa | 46.03 | 4.8 | 67 | 25.4 | 50 | 83.3133 |
| 44 |  Honduras HNDCentral America | 45.68 | 49.5 | 67 | 24.3 | 6 | 82.3333 |
| 45 |  Guinea GINWestern Africa | 43.96 | 60.0 | 17 | 26.5 | 50 | 66.6667 |
| 46 |  Mongolia MNGEastern Asia | 43.54 | 9.5 | 50 | 47.1 | 11 | 99.9998 |
| 47 |  Laos LAOSouth-eastern Asia | 42.63 | 64.8 | 50 | 20.6 | 11 | 66.6666 |
| 48 |  Somalia SOMEastern Africa | 41.88 | 77.1 | 0 | 43.4 | 22 | 66.6667 |
| 49 |  Mauritania MRTWestern Africa | 40.52 | 43.8 | 33 | 26.5 | 33 | 65.6667 |
| 50 |  Burundi BDIEastern Africa | 37.28 | 30.5 | 33 | 41.3 | 50 | 31.3333 |
| 51 |  Central African Republic CAFMiddle Africa | 35.36 | 59.0 | 17 | 21.7 | 33 | 46.0633 |
| 52 |  Solomon Islands SLBMelanesia | 30.44 | 55.2 | 33 | 31.2 | 22 | 10.1833 |
| 53 |  Eritrea ERIEastern Africa | 27.75 | 30.5 | 17 | 26.5 | 0 | 65.1333 |
| 54 |  Republic of the Congo COGMiddle Africa | 26.81 | 38.1 | 33 | 25.4 | 6 | 31.6667 |
| 55 |  South Sudan SSDEastern Africa | 26.61 | 14.3 | 17 | 4.8 | 33 | 64.0100 |
| 56 | YemenYEMWestern Asia | 9.47 | 28.6 | 0 | 13.2 | 6 | 0.0000 |
02In 2023
At either end
The 5 countries at each end of the headline, then the highest and lowest on each other measure.
Lowest
- 56Yemen9.47
- 55South Sudan26.61
- 54Republic of the Congo26.81
- 53Eritrea27.75
- 52Solomon Islands30.44
A higher value is the better result. The middle country reads 65.67. “Shared” marks a value another country also holds.
Each measure’s ends
Electrification governance and planning
Highest3 share it
Lowest
Zimbabwe4.8Middle country: 73.3
Grid electrification framework
Highest10 share it
Lowest2 share it
Middle country: 58
Mini-grids framework
Highest
Kenya100.0Lowest
South Sudan4.8Middle country: 58.7
Off-grid systems framework
Highest8 share it
Lowest
Eritrea0Middle country: 56
Consumer affordability of electricity
Highest
Mongolia99.9998Lowest
Yemen0.0000Middle country: 82.3333
032022 → 2023
Since 2022
- +0 / −0countries joined / left
- 38values changed, of 56 in both
- 32 · 6rose · fell
- 18unchanged
Rose most
- Uganda30.59 → 84.55+53.97
- Pakistan40.60 → 69.26+28.67
- Kenya65.13 → 89.23+24.11
- South Africa40.68 → 64.59+23.90
- Nigeria73.96 → 90.47+16.51
Fell most
- Senegal77.08 → 69.88−7.20
- Eritrea33.46 → 27.75−5.71
- Chad61.14 → 55.42−5.71
- Angola78.39 → 77.44−0.95
- Philippines80.42 → 79.47−0.95
04Caveats
Read before you use
One year of the 2024 release
Every year in this series comes from ESMAP’s 2024 release, recalculated on one method, so a change from one year to the next is not a revision. It can differ from what was first published for 2023.
Nothing missing
Every one of the 56 countries has every column.
05The files
Download and cite
- .csv
For a spreadsheet or code
56 rows · 7.4 KB · UTF-8, opens in Excel
Opens with 11 lines of source notes; the table starts on row 13.
Download rise-electricity-access-2023-nations-inquiry.csv - ↗
The publisher’s original
ESMAP’s own file, on its own site.
WB_RISE_WIDEF.csv
What this site changed: Reshaped to one row per country, with its ISO code; no value recalculated, rescaled or rounded. In full
Licence: CC BY 4.0 · what it allows, in plain words
Cite this edition
World Bank Group (ESMAP) (2023). RISE Electricity Access Policy Score, 2023 [data set], describing 2023. As held by Nations Inquiry, https://nationsinquiry.com/datasets/rise-electricity-access/2023
0614 held
Other years
‹ The year before
RISE Electricity Access Policy Score, 202256 countries
The year after ›
This is the newest year; the next will get a page of its own.
All of them
RISE Electricity Access Policy Score: every year14 held, with the data dictionary, coverage and licence.
How it has moved, charted by country