Edition 2020
Global Report on Food Crises 2020
Published 2020 · describes 2019 · stored as published, never rewritten
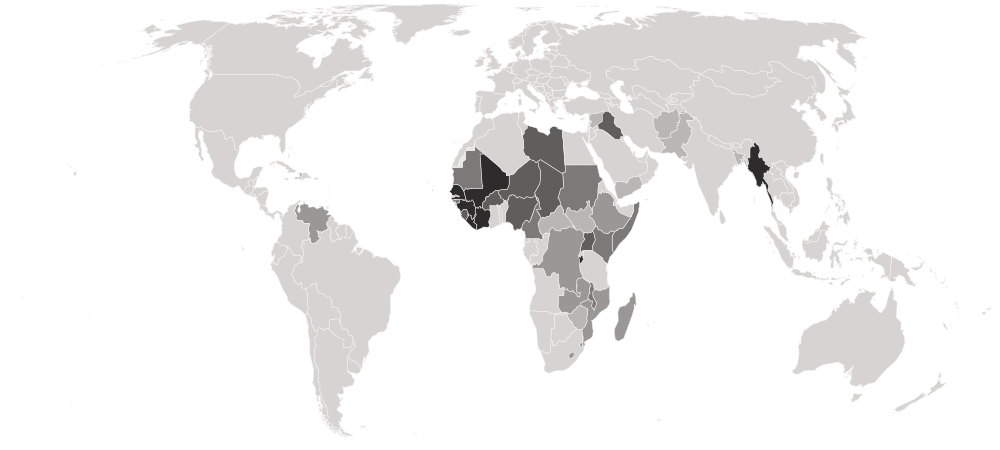
Global Report on Food Crises 2020 covers 41 countries on 3 measures. South Sudan is highest, at 61; Côte d’Ivoire is lowest, at 0. The middle country reads 15. Against the 2019 edition, 31 values changed (18 up, 13 down), 3 countries joined, 2 left.
Global Report on Food Crises · Edition 2020

HighestSouth Sudan
61
LowestCôte d’Ivoire
0Shaded by value in five groups of equal size, darkest at the lowest end.
01Position · derived
The table
Every country and every column of Global Report on Food Crises 2020, as published. FSIN ranks nobody on this measure; the position is derived here by ordering the published values. “=” marks a shared position.
Showing 25 of 41 countries · select a heading to sort
| derived | ||||
|---|---|---|---|---|
| 1 | South SudanSSDEastern Africa | 61 | 6,956,000 | 11,385,139 |
| 2 |  Yemen YEMWestern Asia | 53 | 15,900,000 | 29,884,585 |
| 3 |  Pakistan PAKSouthern Asia | 51 | 3,067,706 | 5,961,083 |
| 4 |  Central African Republic CAFMiddle Africa | 42 | 1,809,109 | 4,391,870 |
| =5 |  Afghanistan AFGSouthern Asia | 38 | 13,902,678 | 36,660,879 |
| =5 |  Zimbabwe ZWEEastern Africa | 38 | 3,580,214 | 9,420,663 |
| 7 |  Bangladesh BGDSouthern Asia | 37 | 1,299,000 | 3,505,000 |
| 8 |  Syria SYRWestern Asia | 36 | 6,600,000 | 18,300,000 |
| 9 |  Haiti HTICaribbean | 35 | 3,673,127 | 10,450,082 |
| 10 |  Mozambique MOZEastern Africa | 34 | 1,689,408 | 4,983,961 |
| 11 |  Venezuela VENSouth America | 32 | 9,300,000 | 28,515,829 |
| 12 |  Lesotho LSOSouthern Africa | 30 | 433,727 | 1,455,255 |
| 13 |  Madagascar MDGEastern Africa | 28 | 1,306,975 | 4,601,075 |
| 14 |  Ethiopia ETHEastern Africa | 27 | 7,966,980 | 28,727,077 |
| 15 |  DR Congo CODMiddle Africa | 26 | 15,577,676 | 59,872,947 |
| 16 |  Eswatini SWZSouthern Africa | 25 | 232,373 | 943,835 |
| 17 |  Zambia ZMBEastern Africa | 24 | 2,278,098 | 9,245,232 |
| =18 |  Kenya KENEastern Africa | 22 | 3,096,614 | 13,881,444 |
| =18 |  Malawi MWIEastern Africa | 22 | 3,306,391 | 15,329,133 |
| 20 |  Somalia SOMEastern Africa | 17 | 2,094,000 | 12,327,530 |
| 21 |  Mauritania MRTWestern Africa | 15 | 606,647 | 4,077,344 |
| 22 |  Sudan SDNNorthern Africa | 14 | 5,852,810 | 41,934,359 |
| =23 |  Gambia GMBWestern Africa | 10 | 187,564 | 1,961,480 |
| =23 |  Guinea-Bissau GNBWestern Africa | 10 | 131,170 | 1,276,307 |
| 25 |  Cameroon CMRMiddle Africa | 8 | 1,368,372 | 16,121,122 |
| 26 |  Niger NERWestern Africa | 7 | 1,444,905 | 21,915,357 |
| 27 |  Burkina Faso BFAWestern Africa | 6 | 1,219,079 | 21,398,997 |
| =28 |  Iraq IRQWestern Asia | 5 | 1,770,000 | 39,309,789 |
| =28 |  Libya LBYNorthern Africa | 5 | 336,000 | 6,700,000 |
| =28 |  Nigeria NGAWestern Africa | 5 | 4,997,836 | 103,665,605 |
| =31 |  Chad TCDMiddle Africa | 4 | 640,874 | 14,340,527 |
| =31 |  Sierra Leone SLEWestern Africa | 4 | 347,934 | 8,065,730 |
| =31 |  Uganda UGAEastern Africa | 4 | 1,500,000 | 40,000,000 |
| =34 |  Guinea GINWestern Africa | 3 | 286,553 | 10,070,393 |
| =34 |  Mali MLIWestern Africa | 3 | 648,330 | 20,537,000 |
| =34 |  Senegal SENWestern Africa | 3 | 359,646 | 13,153,814 |
| =37 |  Burundi BDIEastern Africa | 2 | 200,000 | 11,500,000 |
| =37 |  Cabo Verde CPVWestern Africa | 2 | 9,871 | 481,156 |
| =39 |  Liberia LBRWestern Africa | 1 | 41,411 | 4,349,564 |
| =39 |  Myanmar MMRSouth-eastern Asia | 1 | 711,980 | 54,045,422 |
| 41 | Côte d’IvoireCIVWestern Africa | 0 | 59,028 | 19,752,781 |
02In 2019
At either end
The 5 countries at each end of the headline, then the highest and lowest on each other measure.
Highest
- 1South Sudan61
- 2Yemen53
- 3Pakistan51
- 4Central African Republic42
- 5Afghanistanshared38
Lowest
- 41Côte d’Ivoire0
- 39Myanmarshared1
- 39Liberiashared1
- 37Cabo Verdeshared2
- 37Burundishared2
A higher value is the worse result. The middle country reads 15. “Shared” marks a value another country also holds.
Each measure’s ends
People in Phase 3+
Highest
Yemen15,900,000Lowest
Cabo Verde9,871Middle country: 1,444,905
Population analysed
Highest
Nigeria103,665,605Lowest
Cabo Verde481,156Middle country: 12,327,530
032019 → 2020
Since the 2019 edition
What changed between the 2019 edition and this one: who joined or left, and how far the headline moved.
- +3 / −2countries joined / left
- 31values changed, of 38 in both
- 18 · 13rose · fell
- 7unchanged
Rose most
- Mozambique6 → 34+28
- Ethiopia8 → 27+19
- Zimbabwe20 → 38+18
- Kenya6 → 22+16
- Lesotho19 → 30+11
Fell most
- Bangladesh87 → 37−50
- Pakistan87 → 51−36
- Madagascar51 → 28−23
- Burundi16 → 2−14
- Myanmar11 → 1−10
+ Uganda+ Venezuela+ Zambia − Djibouti
 − Türkiye
Changes in value, not in places: a country’s place also moves when others do. Every country’s full history is charted on the statistic page.
04Caveats
Read before you use
What this edition’s numbers are and are not, worked out from the file itself.
This edition describes 2019
FSIN names each edition for the year it is released; the figures in Global Report on Food Crises 2020 are for 2019.
30 distinct values among 41
Values are stored exactly as published, to 15 decimals. 3 countries share 5. Countries sharing a value share a position too.
The position is ours
FSIN publishes values only; the order is this site’s.
Nothing missing
Every one of the 41 countries has every column.
05The files
Download and cite
The table as a file, digit for digit, what this site changed, and a citation for this edition.
- .csv
For a spreadsheet or code
41 rows · 2.7 KB · UTF-8, opens in Excel
Opens with 11 lines of source notes; the table starts on row 13.
Download food-crises-2020-nations-inquiry.csv - ↗
The publisher’s original
FSIN’s own file, on its own site.
grfc_afi_database_2016-2025_september_update.xlsx
What this site changed: Reshaped into one row per country: regional and income-group totals are left out, only the columns listed are kept, each row gets its ISO 3166 code, and some country names are brought to one spelling. No value is recalculated, rescaled or rounded.
Licence: CC BY 4.0 · what it allows, in plain words
Cite this edition
Food Security Information Network (FSIN) (2020). Global Report on Food Crises 2020 [data set], describing 2019. As held by Nations Inquiry, https://nationsinquiry.com/datasets/food-crises/2020
069 held
Other editions
‹ The edition before
Global Report on Food Crises 2019describes 2018 · 40 countries
The edition after ›
Global Report on Food Crises 2021describes 2020 · 42 countries
All of them
Global Report on Food Crises: every edition9 held, with the data dictionary, coverage and licence.
How it has moved, charted by country
07Questions
Global Report on Food Crises 2020: questions and answers
Which country has the highest acute food insecurity in Global Report on Food Crises 2020?
South Sudan, at 61, of the 41 countries in the file.
What year does Global Report on Food Crises 2020 describe?
2019.
How many countries does Global Report on Food Crises 2020 cover?
41.
Where can I download Global Report on Food Crises 2020?
On this page, as a CSV file holding every value exactly as published, or from the publisher’s own site, linked below.
Is Global Report on Food Crises 2020 the newest?
No. The newest held here is Global Report on Food Crises 2025.