Dataset · World Bank Group
Industry Value Added including Construction (% of GDP)
51 years, 1975–2025 · 158 countries
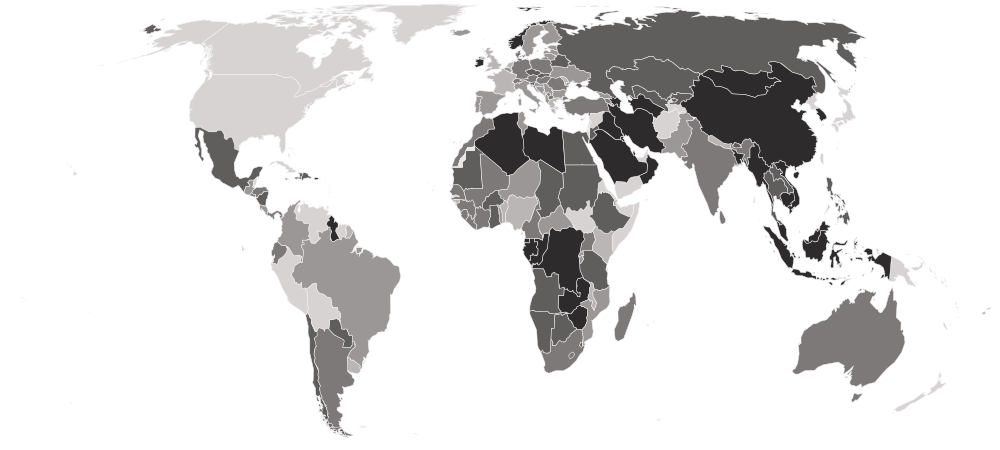
Industry value added covers mining, manufacturing, construction, electricity, water and gas together, as a share of GDP — the widest of the three sector shares on this site, and the reason oil states sit at the top of it with readings near 97%.
This site holds every year from 1975 to 2025, read from World Bank Group’s own data and stored exactly as published.
Industry Value Added including Construction (% of GDP) · the file
- Newest
- Industry Value Added including Construction (% of GDP), 2025
- Held
- 51 years · 8,103 rows
- Licence
- CC BY 4.0
0151 years
Every year
Every year comes from World Bank Group’s 2026 release, recalculated on one method. Each opens the full table for that year; each downloads as a CSV.
Show all 51 years
Every year in one file, one row per country per year: industry-value-added-all-editions-nations-inquiry.csv
023 columns
What’s in the file
Every column, what it holds, how it is stored and what its values look like — what a reader needs before opening the file.
| Column | What it holds | Stored as | Range, 2025 | Distinct | Empty | Spread |
|---|---|---|---|---|---|---|
CountrycountryName | The country’s name, as this file spells it. | Text | — | 158 | 0 | |
ISO Codecountry_codeIdentifier | The ISO 3166-1 alpha-3 code, added by this site. Every table here joins on it. | Text · 3 letters | — | 158 | 0 | |
Industry, including construction, value added (% of GDP)industry_value_addedHeadline | The headline figure: Industry, including construction, value added (% of GDP). | Number · up to 14 decimals | 2.228 São Tomé and Príncipe75.088  Guyanamiddle 24.654 | 158 | 0 |
Profiled from the newest file. Range: the lowest and highest value, with the country holding it when only one does. Spread: countries in ten equal steps from lowest to highest. Neither end is better. The values describe a shape, not a score.
03208 countries across every year
Who is covered
How many countries each year holds, continent by continent, who joined and who left, and which places this site covers that the dataset never has.
| 2014 | 2015 | 2016 | 2017 | 2018 | 2019 | 2020 | 2021 | 2022 | 2023 | 2024 | 2025 | |
|---|---|---|---|---|---|---|---|---|---|---|---|---|
| Africa | 52 | 52 | 51 | 51 | 51 | 51 | 51 | 51 | 51 | 51 | 51 | 51 |
| Americas | 42 | 42 | 42 | 42 | 42 | 42 | 42 | 42 | 40 | 39 | 37 | 25 |
| Asia | 49 | 49 | 49 | 49 | 49 | 48 | 48 | 48 | 48 | 47 | 47 | 37 |
| Europe | 45 | 46 | 47 | 47 | 47 | 47 | 47 | 47 | 47 | 47 | 43 | 41 |
| Oceania | 15 | 15 | 14 | 14 | 13 | 14 | 13 | 12 | 12 | 12 | 11 | 4 |
| All | 203 | 204 | 203 | 203 | 202 | 202 | 201 | 200 | 198 | 196 | 189 | 158 |
The newest 12 of 51 years.
Who joined and who left
- 2025
 − Afghanistan
 − United Arab Emirates
 − Bahamas
 − Belize
 − Bermuda
 − Bolivia
 − Barbados
 − Cuba
 − Curaçao
 − Cayman Islands
 − Faroe Islands
 − Hong Kong
 − Israel
 − Japan
 − Kiribati
 − Lebanon
 − Macau
 − Monaco
 − Marshall Islands
 − Peru
 − Palau
 − Papua New Guinea
 − Palestine
 − Solomon Islands
 − Suriname
 − Turks and Caicos Islands
 − Tajikistan
 − Timor-Leste
 − Tonga
 − Trinidad and Tobago
 − Vanuatu
- 2024
 − Aruba− Channel Islands
 − Greenland
 − Isle of Man
 − Liechtenstein
 − New Zealand
 − San Marino
- 2023
 − Canada
 − Syria
- 2022
 − Sint Maarten
 − United States
- 2021
 − French Polynesia
- 2020
 − New Caledonia
- 2019+ New Caledonia
 − Yemen
- 2018− New Caledonia
Not in this dataset · 17 places this site covers
World Bank Group gives no figure for these in any year held here. It is the publisher’s choice of scope, and each place’s profile shows what is measured.














04Provenance
Where it comes from
The path from the publisher to this page, and what was checked and changed on the way.
1 · Publisher
World Bank Group
2 · Their file
Industry Value Added including Construction (% of GDP) 2025
3 · Read by this site
September 6, 2026
Imported by a script that parses each figure and writes it down unrounded.4 · Stored as
51 files, one per year
Each downloads as a CSV, or every year together as industry-value-added-all-editions-nations-inquiry.csv5 · Used on
Its statistic page, and every profile it measures
Precision
The headline is stored to 14 decimals, as published.
Rounded by this site
Never. Tables on screen may show fewer decimals; the files never do.
Changed by this site
Reshaped into one row per country: regional and income-group totals are left out, only the columns listed are kept, each row gets its ISO 3166 code, and some country names are brought to one spelling. No value is recalculated, rescaled or rounded.
Pulled from the World Bank’s indicator API (NV.IND.TOTL.ZS). 40 country-years recorded as exactly 0 are treated as missing.
05Reuse
Licence and credit
What the publisher’s licence lets you do, what it asks of you, and a credit line and citation ready to copy.
Licence · checked September 6, 2026
- Share and redistribute it
- Adapt it and build on it
- Use it commercially
- Credit the publisher
- Say what you changed
Share, adapt and use commercially. Credit the publisher and say if you changed anything.
A credit line
Source: World Bank Group, Industry Value Added including Construction (% of GDP), via Nations Inquiry.
Cite this dataset
World Bank Group. Industry Value Added including Construction (% of GDP), 1975–2025 [data set]. As held by Nations Inquiry, https://nationsinquiry.com/datasets/industry-value-added
The publisher’s own citation: World Bank. World Development Indicators. Washington, DC: World Bank Group.
Plain-language summary, not legal advice. The licence text is what binds.
06Questions
Industry Value Added including Construction (% of GDP): questions and answers
What is the Industry Value Added including Construction (% of GDP)?
Industry value added covers mining, manufacturing, construction, electricity, water and gas together, as a share of GDP — the widest of the three sector shares on this site, and the reason oil states sit at the top of it with readings near 97%.
Which years of the Industry Value Added including Construction (% of GDP) can I download?
All 51, from 1975 to 2025, each as a CSV file, or every year together in one CSV.
Does World Bank Group rank countries on it?
No. World Bank Group publishes values only. The positions shown on this site are derived by ordering the published values, and are labelled as ours.
Can I use it commercially?
Yes, under CC BY 4.0, with credit to World Bank Group. The licence text is linked on this page.