
Photo: Alexandre Buisse ( ) · CC BY-SA 3.0 · via Wikimedia Commons, shown in greyscale
Topic 10 of 18 · Country Index 2026
Chile: Peace & Security
Is a country at peace, and how heavily armed is it?
Chile is placed 79th of 177 countries on peace & security in the Country Index 2026, from 4 of its 4 key statistics. Readings behind it: Political Stability and Absence of Violence 0.171 (2025); Physical Violence Index 0.929 (2025).
Share
Peace & Security
79th
of 177 countries placed
Placed from 4 of 4 key statistics
- 0.171Political Stability and Absence of Violence, 2025Political Stability estimate (−2.5 to 2.5)
- 0.929Physical Violence Index, 2025Freedom from political killings and torture (0–1)
- -0.571Political Violence by Non-State Actors, 2025Original latent estimate (≈ −3.5 to +4); higher = more violence
- 114.1Global Militarisation Index, 2023GMI score (higher means a heavier military weight)
01The evidence
The 4 key statistics that decide it
Only these place Chile on peace & security — one vote each. Every value is the publisher’s own, read at the edition the Country Index 2026 used; the grey ticks are every other country it was compared with, lowest on the left.
Key 1 of 4
Political Stability and Absence of Violence
World Bank Group
2025 edition · data for 2025 · CC BY 4.0
0.171
Political Stability estimate (−2.5 to 2.5)
Higher is better
Chile: 0.171. Across the 211 countries in this edition, values run from -2.506 (Yemen) to 1.563 (Andorra); the world median is 0.171.
- World median
- 0.171
- Best in South America
- 1.3 Uruguay
- Land neighbours
- Argentina 0.162 · Bolivia -0.164 · Peru -0.497
Key 2 of 4
Physical Violence Index
V-Dem Institute, University of Gothenburg
2025 edition · data for 2025 · CC BY-SA 4.0
0.929
Freedom from political killings and torture (0–1)
Higher is better
Chile: 0.929. Across the 176 countries in this edition, values run from 0.053 (North Korea) to 0.989 (Sweden); the world median is 0.79.
- World median
- 0.79
- Best in South America
- 0.977 Uruguay
- Land neighbours
- Argentina 0.865 · Bolivia 0.7 · Peru 0.829
Key 3 of 4
Political Violence by Non-State Actors
V-Dem Institute, University of Gothenburg
2025 edition · data for 2025 · CC BY-SA 4.0
-0.571
Original latent estimate (≈ −3.5 to +4); higher = more violence
Lower is better
Chile: -0.571. Across the 171 countries in this edition, values run from -3.182 (Luxembourg) to 3.375 (Myanmar); the world median is -0.661.
- World median
- -0.661
- Best in South America
- -3.126 Uruguay
- Land neighbours
- Argentina -1.814 · Bolivia 2.065 · Peru -0.089
Key 4 of 4
Global Militarisation Index
Bonn International Centre for Conflict Studies (BICC)
2023 edition · data for 2023 · CC BY
114.1
GMI score (higher means a heavier military weight)
Lower is better
Ranked 61st of 149 by BICC
Chile: 114.1. Across the 149 countries in this edition, values run from 3.512 (Haiti) to 351.09 (Ukraine); the world median is 100.66.
- World median
- 100.66
- Best in South America
- 55.24 Guyana
- Land neighbours
- Argentina 56.53 · Bolivia 87.68 · Peru 94.62
02Over time
Which way Chile is moving
Each key’s published value, edition by edition, beside the world median. The Country Index 2026 is the first edition of the standing, so the standing itself has no history to chart yet.
Political Stability and Absence of Violence
Political Stability estimate (−2.5 to 2.5) · higher is better
ChileWorld median
Chile fell from 0.594 in 2000 to 0.171 in 2025; the world median went from -0.021 to 0.171.
Every year’s figures
Year Chile World median 2025 0.171 0.1706 2024 0.279 0.1385 2023 0.115 0.1269 2022 0.006 0.0991 2021 0.150 0.0836 2020 0.143 0.0582 2019 0.182 0.0678 2018 0.679 0.1121 2017 0.591 0.0177 2016 0.593 -0.0161 2015 0.683 0.0464 2014 0.727 0.0366 2013 0.578 -0.0060 2012 0.609 0.0470 2011 0.610 -0.0034 2010 0.912 0.0100 2009 0.865 0.1579 2008 0.765 0.0744 2007 0.779 0.1154 2006 0.881 0.0812 2005 0.931 0.0308 2004 0.644 -0.0307 2003 0.809 0.0683 2002 0.984 -0.0154 2000 0.594 -0.0212 Physical Violence Index
Freedom from political killings and torture (0–1) · higher is better
ChileWorld median
Chile rose from 0.922 in 2000 to 0.929 in 2025; the world median went from 0.728 to 0.79.
Every year’s figures
Year Chile World median 2025 0.93 0.7900 2024 0.93 0.7850 2023 0.93 0.7885 2022 0.93 0.8190 2021 0.90 0.8245 2020 0.83 0.8265 2019 0.80 0.8015 2018 0.87 0.8200 2017 0.95 0.7880 2016 0.95 0.7865 2015 0.95 0.7930 2014 0.97 0.7790 2013 0.97 0.7700 2012 0.92 0.7805 2011 0.92 0.7900 2010 0.92 0.7990 2009 0.92 0.7890 2008 0.92 0.7770 2007 0.92 0.7700 2006 0.92 0.7700 2005 0.92 0.7550 2004 0.92 0.7700 2003 0.92 0.7600 2002 0.92 0.7440 2001 0.92 0.7480 2000 0.92 0.7280 Political Violence by Non-State Actors
Original latent estimate (≈ −3.5 to +4); higher = more violence · lower is better
ChileWorld median
Chile rose from -0.952 in 2000 to -0.571 in 2025; the world median went from -0.766 to -0.661.
Every year’s figures
Year Chile World median 2025 -0.571 -0.661 2024 -0.947 -0.626 2023 -1.013 -0.617 2022 -0.102 -0.522 2021 0.421 -0.530 2020 0.555 -0.620 2019 0.807 -0.620 2018 -0.952 -0.787 2017 -0.952 -0.651 2016 -0.952 -0.633 2015 -0.952 -0.757 2014 -0.952 -0.748 2013 -0.952 -0.755 2012 -0.952 -0.755 2011 -0.952 -0.737 2010 -0.952 -0.767 2009 -0.952 -0.767 2008 -0.952 -0.798 2007 -0.952 -0.801 2006 -0.952 -0.847 2005 -0.952 -0.743 2004 -0.952 -0.847 2003 -0.952 -0.818 2002 -0.952 -0.770 2001 -0.952 -0.760 2000 -0.952 -0.766 Global Militarisation Index
GMI score (higher means a heavier military weight) · lower is better
ChileWorld median
Chile fell from 140.59 in 2000 to 114.1 in 2023; the world median went from 120.02 to 100.66.
Every year’s figures
Year Chile World median 2023 114.1 100.7 2022 112.7 100.9 2021 114.3 102.9 2020 126.1 104.4 2019 124.1 101.6 2018 125.3 98.1 2017 127.4 101.3 2016 126.5 102.0 2015 127.2 105.7 2014 128.4 103.0 2013 128.8 108.5 2012 130.2 109.5 2011 135.2 112.0 2010 136.4 114.8 2009 142.4 117.0 2008 148.9 114.4 2007 147.3 117.1 2006 153.1 116.5 2005 154.4 113.9 2004 156.8 113.6 2003 154.0 117.9 2002 152.0 120.1 2001 141.2 122.0 2000 140.6 120.0
03In context
Chile beside its neighbours
A position reads best beside the countries around it. Every position below is a place among all 177 countries on peace & security, never a place within the region.
Chile and the countries it borders
Standing among all 177; the key columns are the publishers’ own values.
| Country | Standing | Political Stability and Absence of ViolencePolitical Stability estimate (−2.5 to 2.5) | Physical Violence IndexFreedom from political killings and torture (0–1) | Political Violence by Non-State ActorsOriginal latent estimate (≈ −3.5 to +4); higher = more violence | Global Militarisation IndexGMI score (higher means a heavier military weight) |
|---|---|---|---|---|---|
 Argentina | =30th | 0.162 | 0.865 | -1.814 | 56.53 |
| Chile | 79th | 0.171 | 0.929 | -0.571 | 114.1 |
 Peru | 105th | -0.497 | 0.829 | -0.089 | 94.62 |
 Bolivia | =117th | -0.164 | 0.7 | 2.065 | 87.68 |
“—”: no published reading in that edition. What a standing is
Across South America
Every country in the sub-region, by its place among all 177.

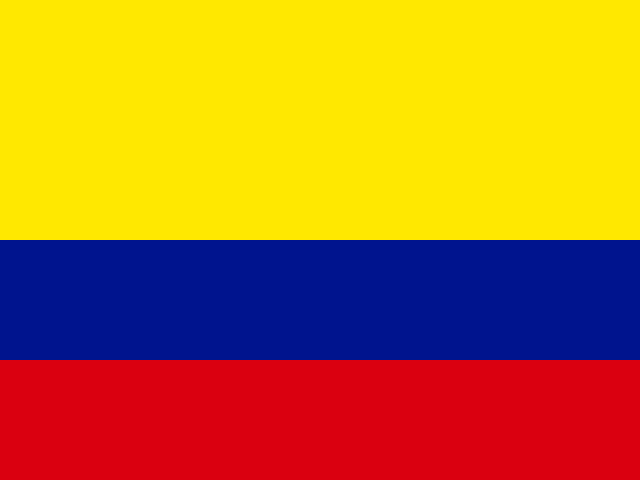
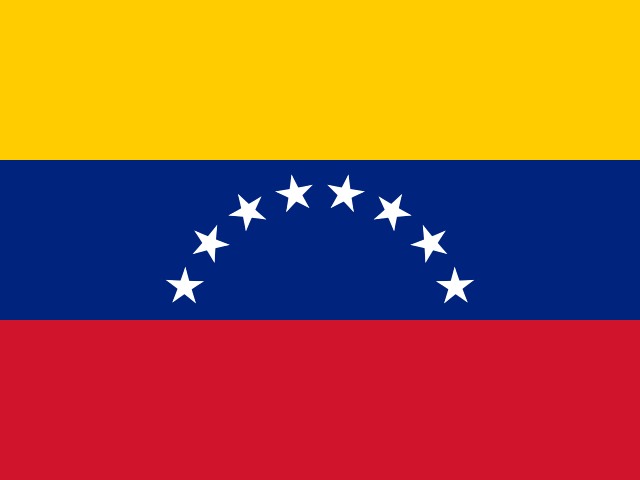
Placed either side on peace & security
The countries immediately above and below Chile in the topic’s list.
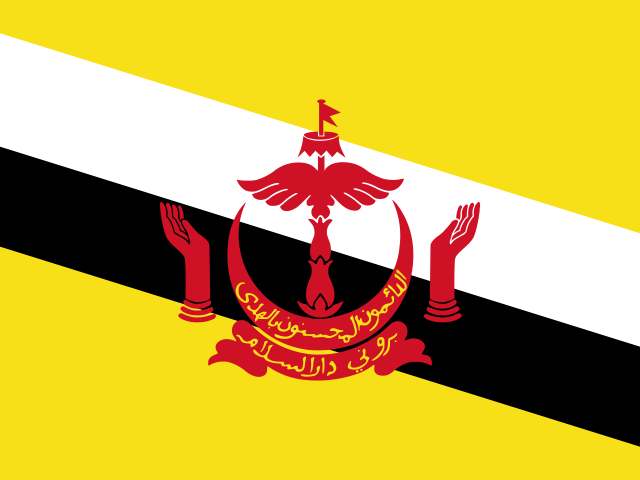
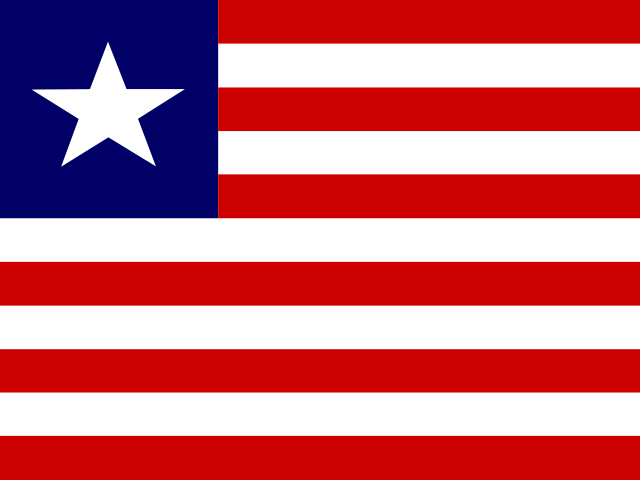
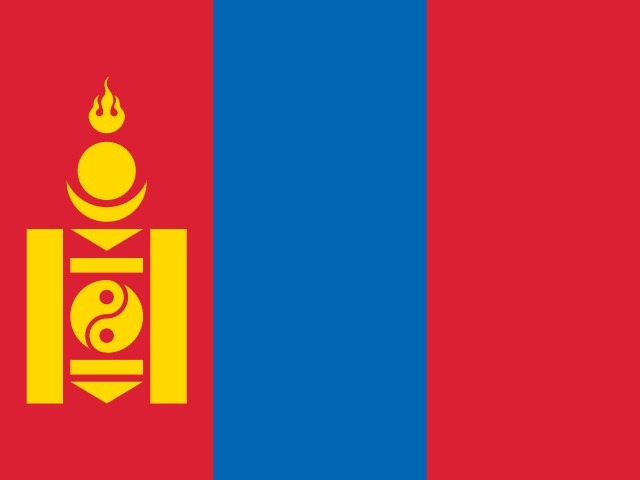
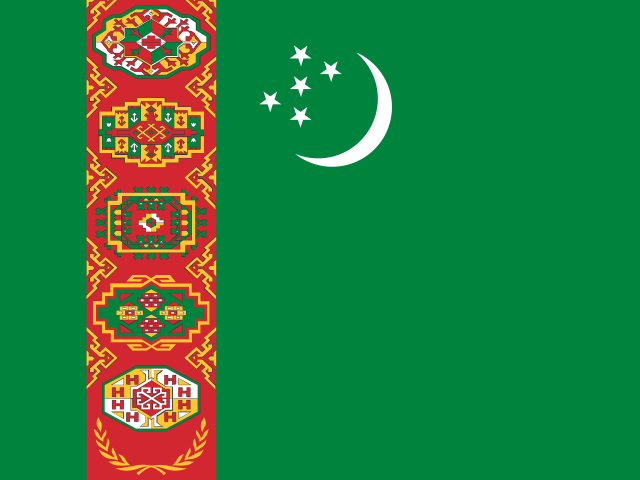
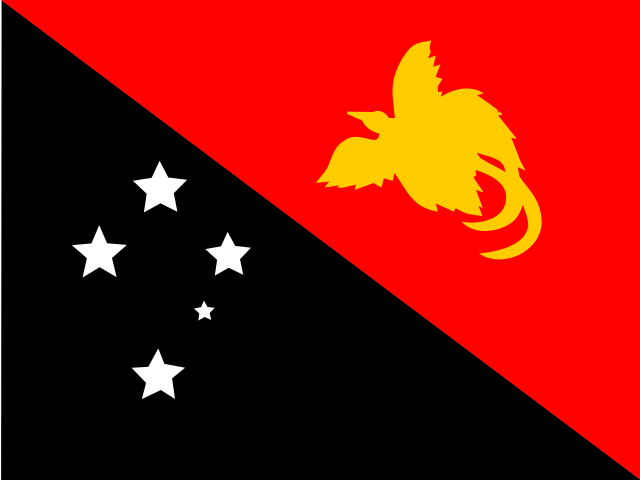
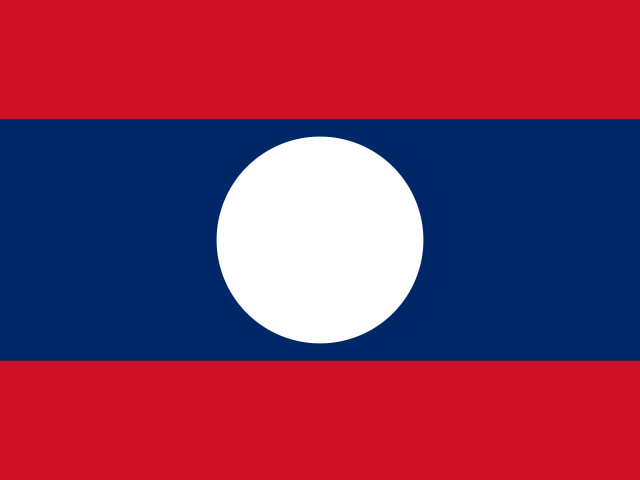
04Context, no vote
Where Chile is ahead of the world, and behind
11 more statistics filed under peace & security, published in full and deliberately given no vote in the standing. Select a row for the publisher, the rank and the links.
Ahead of the world median3
Statistics on which Chile does better than the middle country measured.
Government Cyber Security CapacityV-Dem Institute, University of Gothenburg · 2025 · world median 0.1961.6010.196No real change since 2015
Chile: 1.601 · world median 0.196 · Original latent estimate (≈ −3.6 to +3.7); higher = more capacity. V-Dem Institute, University of Gothenburg, 2025 edition, data for 2025.
Published values in that edition run from -2.66 to 3.715; higher is better.
Position 27th of 176 · derived.
Military Dimension IndexV-Dem Institute, University of Gothenburg · 2025 · world median 0.100.1▼ Worsened since 2015
Chile: 0 · world median 0.1 · Military dimension index (0–1; higher = larger military role). V-Dem Institute, University of Gothenburg, 2025 edition, data for 2025.
Published values in that edition run from 0 to 1; lower is better.
INFORM Risk IndexEuropean Commission Joint Research Centre, with the Inter-Agency Standing Committee · 2025 · world median 3.73.33.7▼ Worsened since 2016
Chile: 3.3 · world median 3.7 · INFORM Risk score (0–10, where 10 is the highest risk). European Commission Joint Research Centre, with the Inter-Agency Standing Committee, 2026 edition, data for 2025.
Published values in that edition run from 0.7 to 8.5; lower is better.
Position 110th of 191 · derived, 1st = worst.
Behind the world median2
Statistics on which Chile does worse than the middle country measured.
Armed Forces Personnel (% of population)U.S. Department of State · 2019 · world median 0.260.390.26▼ Worsened since 2009
Chile: 0.39 · world median 0.26 · Active-duty armed forces personnel (% of population). U.S. Department of State, 2019 edition, data for 2019.
Published values in that edition run from 0.04 to 4.6; lower is better.
State Authority over TerritoryV-Dem Institute, University of Gothenburg · 2025 · world median 95.380.6795.3▼ Worsened since 2015
Chile: 80.67 · world median 95.3 · Territory under effective state control (% of official territory). V-Dem Institute, University of Gothenburg, 2025 edition, data for 2025.
Published values in that edition run from 47.56 to 100; higher is better.
Level with the median, or no median to compare4
Deaths in Organized ViolenceUCDP · 2025 · world median 000No real change since 2015
Chile: 0 · world median 0 · Deaths in organized violence (people). Uppsala Conflict Data Program (UCDP), 2025 edition, data for 2025.
Published values in that edition run from 0 to 90,345; lower is better.
Position 59th of 59 · derived, 1st = worst.
Civilian Deaths in Organized ViolenceUCDP · 2025 · world median 000No real change since 2015
Chile: 0 · world median 0 · Civilians killed in organized violence (people). Uppsala Conflict Data Program (UCDP), 2025 edition, data for 2025.
Published values in that edition run from 0 to 65,911; lower is better.
Deaths in State-Based Armed ConflictUCDP · 2025 · world median 000No real change since 2015
Chile: 0 · world median 0 · Deaths in state-based armed conflict (people). Uppsala Conflict Data Program (UCDP), 2025 edition, data for 2025.
Published values in that edition run from 0 to 90,323; lower is better.
Deaths in Non-State ConflictUCDP · 2025 · world median 000No real change since 2015
Chile: 0 · world median 0 · Deaths in non-state conflict (people). Uppsala Conflict Data Program (UCDP), 2025 edition, data for 2025.
Published values in that edition run from 0 to 7,827; lower is better.
No better end2
These describe the shape of a country — more is not better or worse, only different — so they are never ahead or behind.
Refugees by Country of OriginUNHCR, the UN Refugee Agency · 2025 · world median 1,2725,3581,272Moved since 2015
Chile: 5,358 · world median 1,272 · Refugees under UNHCR's mandate from this country, end of year (people). UNHCR, the UN Refugee Agency, 2025 edition, data for 2025.
Published values in that edition run from 0 to 5,224,131.
Arms Imports (% of total imports)U.S. Department of State · 2019 · world median 0.30.20.3Moved since 2009
Chile: 0.2 · world median 0.3 · Arms imports (% of all imports of goods and services). U.S. Department of State, 2019 edition, data for 2019.
Published values in that edition run from 0 to 61.
No current reading for Chile
Internally Displaced People of Concern to UNHCR. Listed rather than hidden, so the page can be checked against it.
“Position · derived” is this site’s ordering of the published values, 1st = best unless the row says otherwise; the publisher ranks no country on it. Rank, position and standing
05Country Index 2026
Peace & Security among Chile’s 16 topics
Peace & Security is Chile’s 11th best-placed topic of 16. Strongest first, each marker at its share of that topic’s field.
- Governance & Institutionsjoint 23rd of 1944/4 keys
- Democracy & Civil Liberties32nd of 1984/4 keys
- Digital & Technology38th of 1984/4 keys
- Food & Agriculture39th of 1844/4 keys
- Energy37th of 1653/3 keys
- Health & Wellbeing46th of 2004/4 keys
- Economy & Innovation41st of 1764/4 keys
- Development & Human Capital51st of 1963/3 keys
- Education & Knowledge58th of 1983/4 keys
- Mobility & Trade61st of 1774/4 keys
- Peace & Security79th of 1774/4 keys
- Risk & Resilience88th of 1934/4 keys
- Gender & Equality88th of 1834/4 keys
- Work & Labour94th of 1824/4 keys
- Environment & Sustainability105th of 1864/4 keys
- Poverty & Inequality101st of 1593/3 keys
06The top of the list
Who leads on peace & security
The three countries placed highest of 177, and the leaders Chile can most readily be measured against.
 1
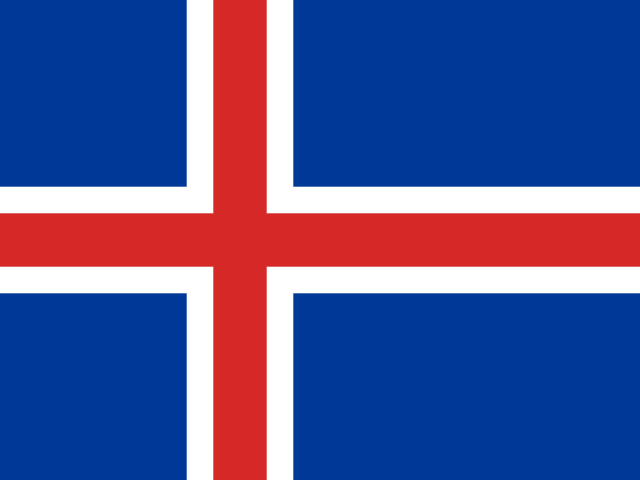 Iceland
Northern Europe
1st of 177 · 3 of 4 keys
Photo: Hansueli Krapf · CC BY-SA 3.0, greyscale
 2
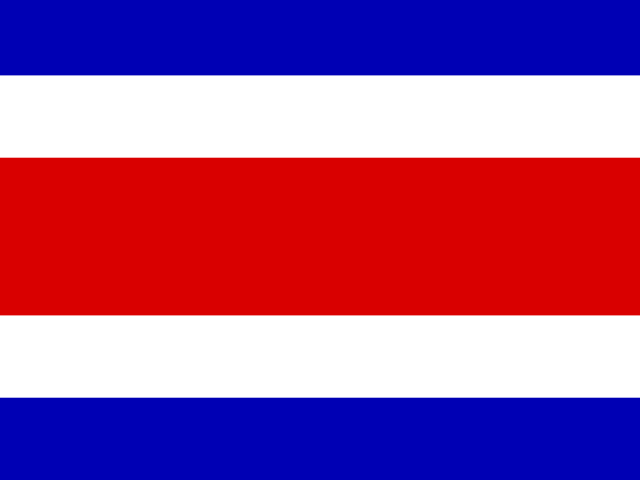 Costa Rica
Central America
2nd of 177 · 3 of 4 keys
Photo: Henry Zbyszynski from Capitola California, USA · CC BY 2.0, greyscale
 3
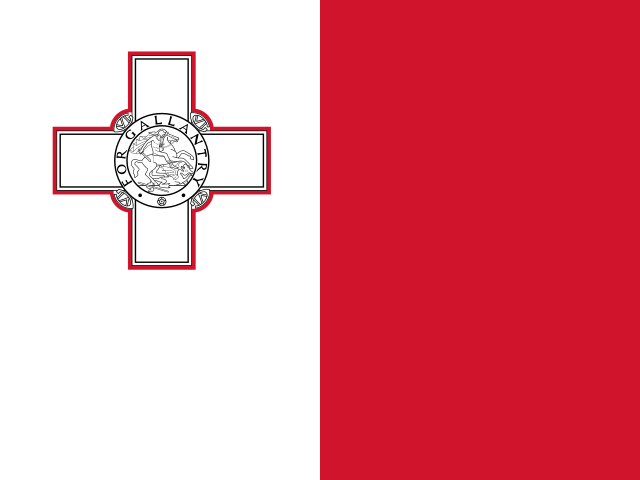 Malta
Southern Europe
3rd of 177 · 4 of 4 keys
Photo: Dirk Heldmaier derivative work: Jjtkk · CC BY-SA 3.0, greyscale
Placed highest nearby
Highest in Americas
Costa Rica2nd3/4 keysHighest in South America
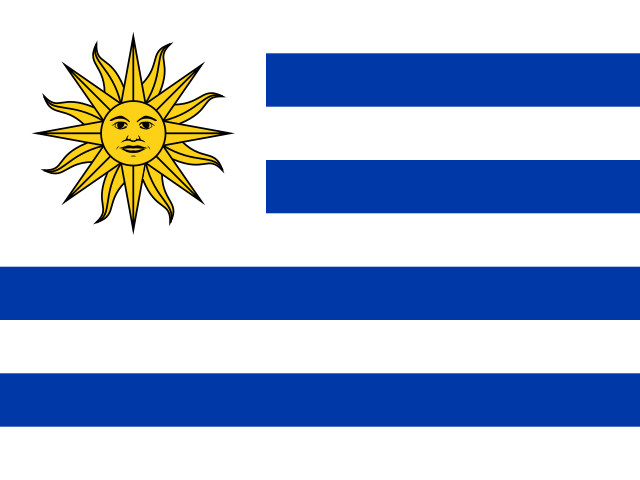 Uruguay14th4/4 keys
This page
Chile79th4/4 keys
Positions out of 177 placed on the topic. A country needs readings on enough keys to be placed, and the top of the list is often held on fewer of them.
07Analysis
Charts and analysis about Chile and peace & security
08Questions
Chile on peace & security: questions answered
Every answer is built from the numbers on this page, so none can say something the page does not.
How does Chile rank on peace & security?
Chile is placed 79th of 177 countries on Peace & Security in the Country Index 2026, from 4 of its 4 key statistics (Political Stability and Absence of Violence, Physical Violence Index, Political Violence by Non-State Actors and Global Militarisation Index). The position is this site’s ordering of published statistics, not a rank any publisher printed.
What is the latest Political Stability and Absence of Violence figure for Chile?
0.171 in 2025 (political Stability estimate (−2.5 to 2.5)), according to World Bank Group. The world median in the same edition was 0.171.
What is the latest Physical Violence Index figure for Chile?
0.929 in 2025 (freedom from political killings and torture (0–1)), according to V-Dem Institute, University of Gothenburg. The world median in the same edition was 0.79.
How does Chile compare with Argentina on peace & security?
Argentina is placed joint 30th of 177, and Chile 79th. Political Stability and Absence of Violence: Argentina 0.162, Chile 0.171; Physical Violence Index: Argentina 0.865, Chile 0.929; Political Violence by Non-State Actors: Argentina -1.814, Chile -0.571; Global Militarisation Index: Argentina 56.53, Chile 114.1.
How have Chile’s peace & security figures changed?
Political Stability and Absence of Violence fell from 0.594 in 2000 to 0.171 in 2025; Physical Violence Index rose from 0.922 in 2000 to 0.929 in 2025; Political Violence by Non-State Actors rose from -0.952 in 2000 to -0.571 in 2025; Global Militarisation Index fell from 140.59 in 2000 to 114.1 in 2023.
Which peace & security statistics are missing for Chile?
No current reading is published for Chile on Internally Displaced People of Concern to UNHCR. They are listed rather than hidden, so the evidence on the page can be checked against it.
09Method
Method, sources and how to cite
What this topic does not measure
Deaths in armed conflict and violent deaths per person are published here as context, because the counts are uneven between years and between sources. Crime in daily life and personal safety are not covered. Humanitarian crises driven by conflict appear in Risk & Resilience.
How the Peace & Security standing is decided
A standing is this site’s ordering, named with its edition — never a publisher’s rank. 4 key statistics vote, one vote each; every country’s published value becomes a place within that key’s own field, the places are averaged, and the average is never published. A country needs 2 of the 4 keys to be placed.
The peace & security method, step by stepHow every standing on this site is built
The key statistics and their licences
- Political Stability and Absence of Violence — World Bank Group, CC BY 4.0
- Physical Violence Index — V-Dem Institute, University of Gothenburg, CC BY-SA 4.0
- Political Violence by Non-State Actors — V-Dem Institute, University of Gothenburg, CC BY-SA 4.0
- Global Militarisation Index — Bonn International Centre for Conflict Studies (BICC), CC BY
The other 11 statistics on this page come from 5 publishers, each named beside its numbers, with every edition and licence on the datasets pages.
The standing itself is part of the Country Index 2026, published under CC BY-SA 4.0.
Photographs
Chile’s banner and the countries placed highest, from their profiles: Wikimedia Commons, shown in greyscale, each used under the licence named.
- Chile (banner) — Alexandre Buisse ( ), CC BY-SA 3.0
- Iceland — Hansueli Krapf, CC BY-SA 3.0
- Costa Rica — Henry Zbyszynski from Capitola California, USA, CC BY 2.0
- Malta — Dirk Heldmaier derivative work: Jjtkk, CC BY-SA 3.0
Cite this page
Nations Inquiry (2026). Chile: Peace & Security — standing and statistics, Country Index 2026. https://nationsinquiry.com/countries/chile/security